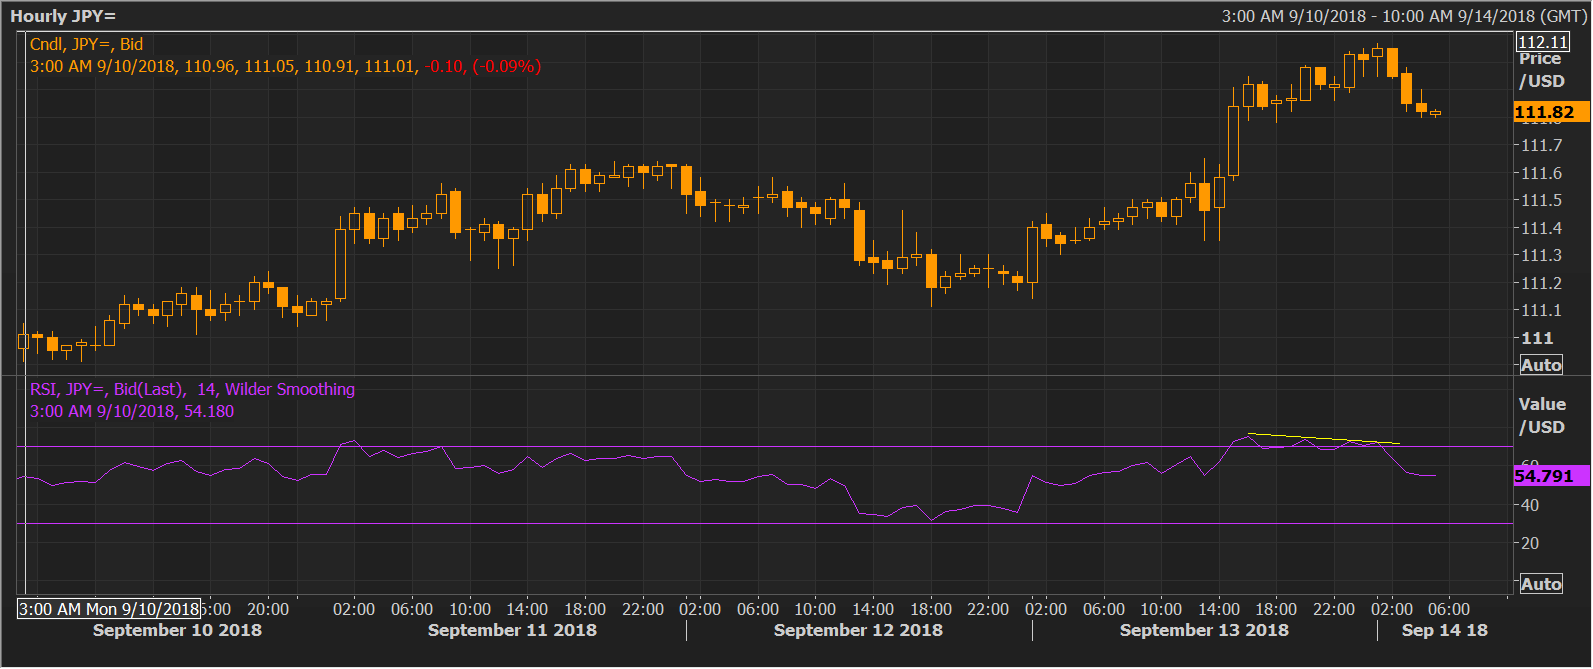
- USD/JPY’s pullback from the six-week high of 112.08 to 111.83 is likely associated with the bearish divergence of the 14-hour relative strength index (RSI), although the short-term outlook still remains bullish, as the 5-day and 10-day moving averages (MAs) are trending north.
- More importantly, the pair closed yesterday above the crucial resistance of 111.83 (Aug. 29 high), signaling a revival of the rally from the Aug. 21 low of 109.77. As a result, the pair looks set to test the highs above 113.00 in the next couple of weeks.
- On the downside, a daily close below the 10-day MA would abort the bullish view.
Hourly Chart
Daily Chart
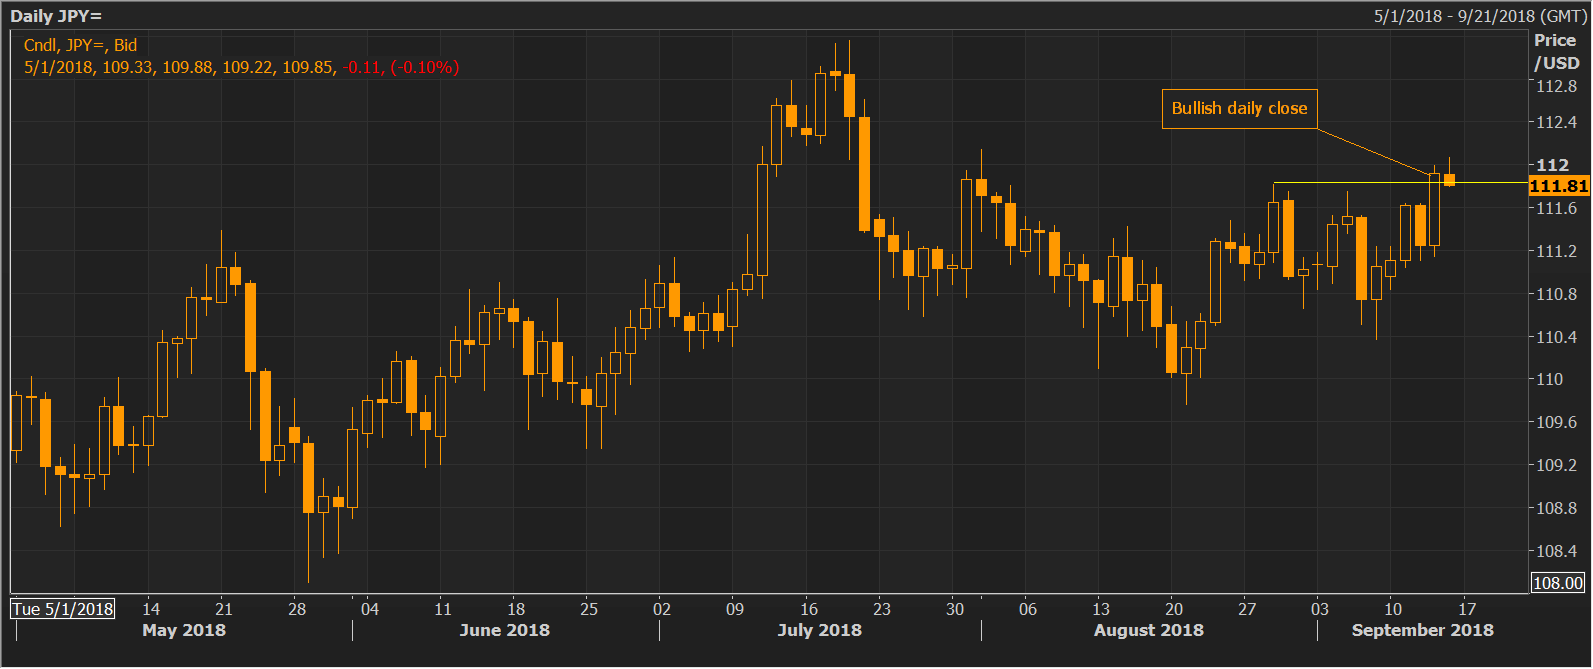
Spot Rate: 111.83
Daily High: 112.08
Daily Low: 111.81
Trend: bull breakout confirmed
R1: 112.15 (Aug. 1 high)
R2: 112.53 (daily pivot R2)
R3: 113.33 (July 19 high)
Support
S1: 111.65 (support of Sep. 11 high as per the hourly chart)
S2: 111.39 (daily pivot S1)
S3: 111.33 (50-day moving average)
