- USD/JPY fails to stay strong beyond 23.6% Fibonacci retracement of the current month upside.
- 50 and 200-bar SMA join 50% Fibonacci retracement to determine the key support confluence.
USD/JPY declines from the two week high while taking rounds to 109.00 during early Tuesday.
The pair fails to remain strong above 23.6% Fibonacci retracement level, which in turn highlights the importance of 108.70/65 support confluence that includes 50 and 200-bar Simple Moving Averages (SMAs), together with 50% Fibonacci Retracement.
In a case whereas sellers ignore 108.65 support, 61.8% Fibonacci retracement level of 108.50 and mid-month low near 108.23 could interrupt the south-run to monthly bottom surrounding 107.90.
Alternatively, pair’s break of 23.6% Fibonacci retracement level of 109.11 could keep upside momentum intact towards 109.30 and monthly tops close to 109.50.
USD/JPY 4-hour chart
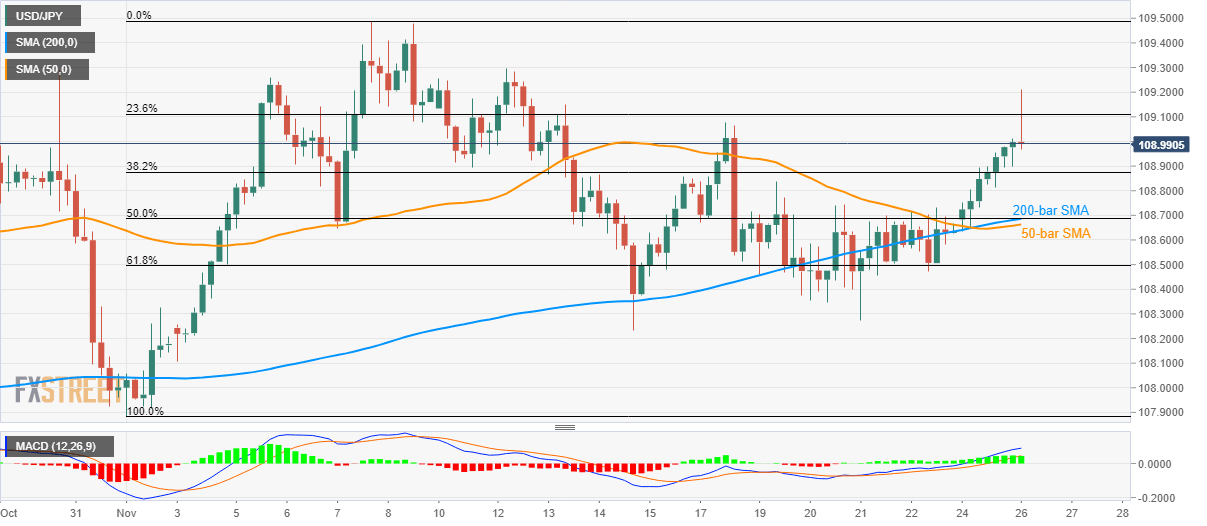
Trend: Pullback expected
