- USD/JPY fell about 80 pips after US President Trump said that he didn’t like interest rate hikes and a strong USD in a CNBC interview. However, USD/JPY already recovered about 45 pips to the upside.
- USD/JPY took a strong hit and is now trading below the 50, 100 and 200-period simple moving averages.
- As long as USD/JPY stays below 112.64 it could indicate that the bearish correction is not over yet and that the bearish pressure can persist.
USD/JPY 15-minute chart
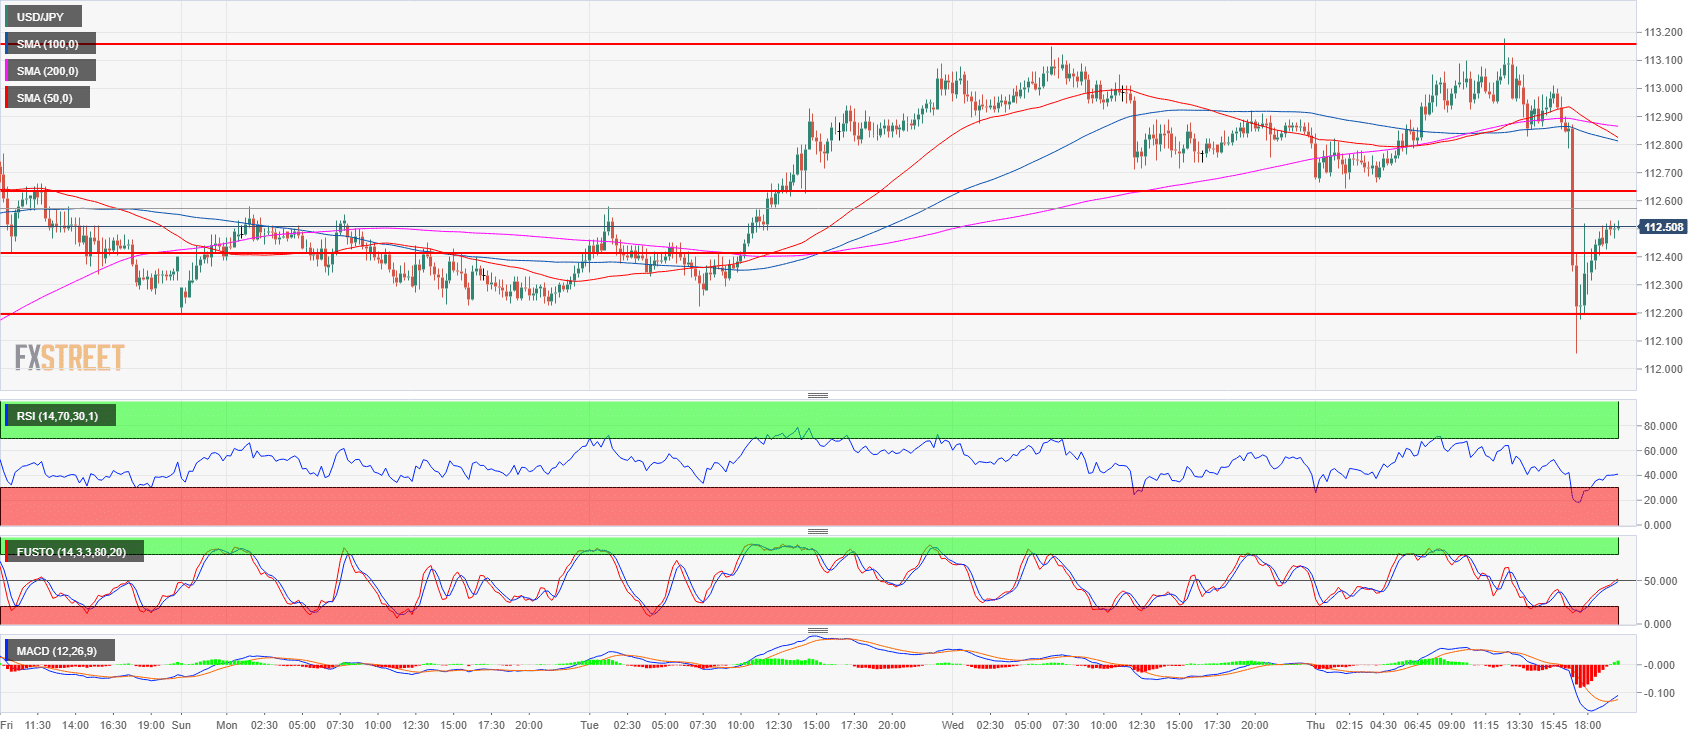
Spot rate: 112.50
Relative change: 0.32%
High: 113.18
Low: 112.05
Trend: Bullish /Bearish correction
Resistance 1: 112.64 July 12 high
Resistance 2: 113.18, 2018 high
Resistance 3: 113.26-113.38, 200-weekly simple moving average and January 8 high
Resistance 4: 114.45 October 27, 2017 high
Support 1: 112.19-112.40 area, July 11 high and intraday swing low
Support 2: 111.60-111.80 area, 23.6% and 23.2% Fibonacci retracement low/high July 11
Support 3: 111.39 May 21 swing high
Support 4: 111.02-111.16 previous intraday swing lows
Support 5: 110.90 June 15 swing high
