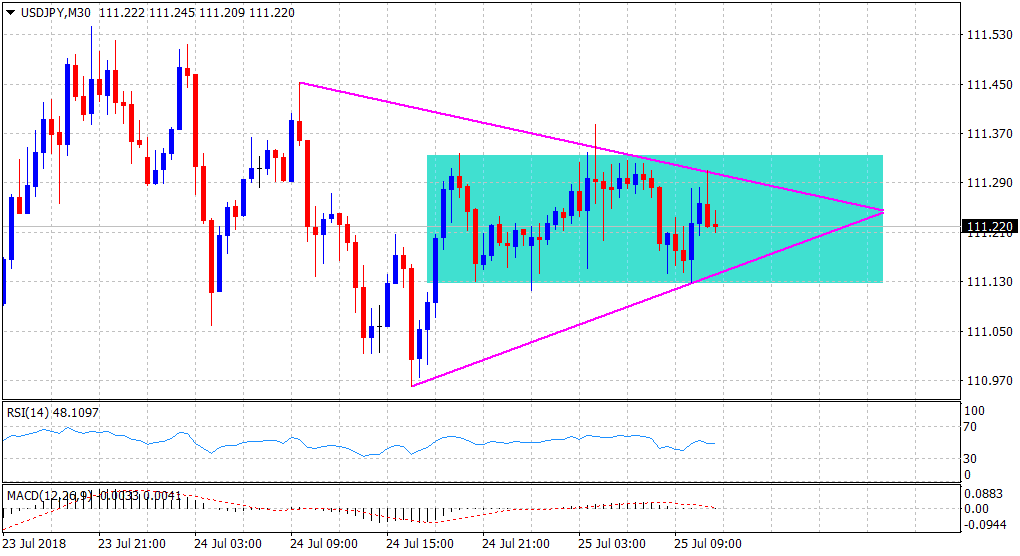
“¢ The pair has been oscillating within a narrow trading range, forming a rectangular chart pattern on the shorter time frame (30-mins.).
“¢ This coupled with the formation of a symmetrical triangle on the said chart points to a consolidation phase before the next leg of directional move.
“¢ Neutral technical indicators add credence to an extension of the near-term range-bound price action ahead of Trump-Juncker trade-related meeting.
Spot rate: 111.22
Daily Low: 111.12
Daily High: 111.39
Trend: Sideways
Resistance
R1: 111.39 (current day swing high)
R2: 111.70 (100-period SMA H1)
R3: 112.07 (R3 daily pivot-point)
Support
S1: 110.93 (200-period SMA H4)
S2: 110.75 (2-week low set on Monday)
S3: 110.35 (S3 daily pivot-point)
