The USD/JPY pair extended the previous session’s sharp rejection slide from 100-day EMA and remained under some heavy selling pressure for the second consecutive session on Friday. The pair is currently placed near multi-month lows – around the 106.80-75 region, as market participants await Friday’s important release of the US NFP report for some meaningful impetus. Meanwhile, technical indicators on hourly charts are flashing extreme oversold conditions and support prospects for a modest bounce back towards the 107.15-20 region, albeit bearish oscillator on the daily chart warrant some caution before placing any aggressive bullish bets. Sustained move beyond the mentioned resistance might prompt some aggressive short-covering move towards 107.85-108.00 region before the pair eventually aims to test the 108.50 intermediate resistance ahead of the 108.80-85 region and the 109.00 round figure mark. Alternatively, a breakthrough the current support area will set the stage for a further near-term depreciating move and accelerate the slide towards the 106.25 intermediate support. The bearish trajectory could further get extended towards the 106.00 handle en-route mid-105.00s.
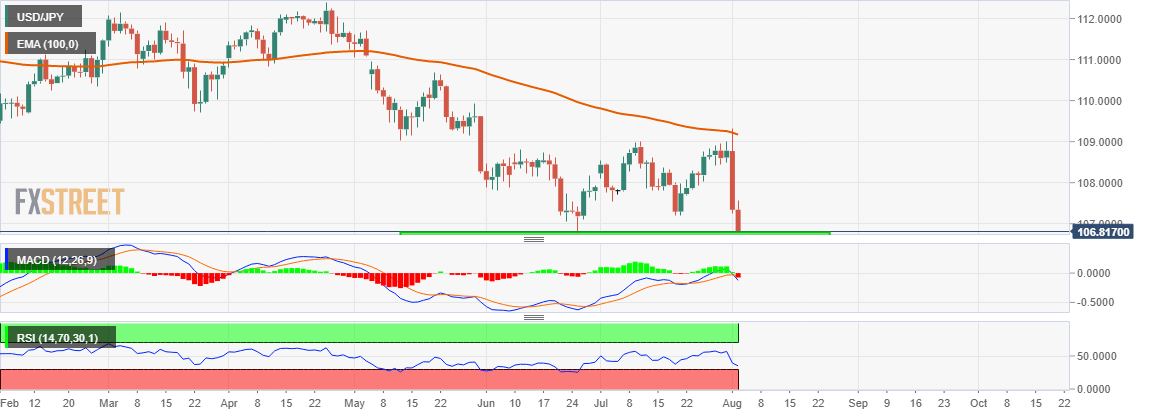
 USD/JPY daily chart FX Street FX Street FXStreet is the leading independent portal dedicated to the Foreign Exchange (Forex) market. It was launched in 2000 and the portal has always been proud of their unyielding commitment to provide objective and unbiased information, to enable their users to take better and more confident decisions. View All Post By FX Street FXStreet News share Read Next Ripple price analysis: XRP/USD mundane trading lags triangle breakout FX Street 4 years The USD/JPY pair extended the previous session's sharp rejection slide from 100-day EMA and remained under some heavy selling pressure for the second consecutive session on Friday. The pair is currently placed near multi-month lows - around the 106.80-75 region, as market participants await Friday's important release of the US NFP report for some meaningful impetus. Meanwhile, technical indicators on hourly charts are flashing extreme oversold conditions and support prospects for a modest bounce back towards the 107.15-20 region, albeit bearish oscillator on the daily chart warrant some caution before placing any aggressive bullish bets. Sustained move beyond the… Regulated Forex Brokers All Brokers Sponsored Brokers Broker Benefits Min Deposit Score Visit Broker 1 $100T&Cs Apply 0% Commission and No stamp DutyRegulated by US,UK & International StockCopy Successfull Traders 9.8 Visit Site FreeBets Reviews$100Your capital is at risk. 2 T&Cs Apply 9.8 Visit Site FreeBets Reviews$100Your capital is at risk. 3 Recommended Broker $100T&Cs Apply No deposit or withdrawal feesTrade major forex pairs such as EUR/USD with leverage up to 30:1 and tight spreads of 0.9 pips Low $100 minimum deposit to open a trading account 9 Visit Site FreeBets ReviewsYour capital is at risk. 4 T&Cs Apply Visit Site FreeBets ReviewsYour capital is at risk. 5 Recommended Broker $0T&Cs Apply Trade gold, silver, and platinum directly against major currenciesUp to 1:500 leverage for forex trading24/5 customer service by phone and email 9 Visit Site FreeBets ReviewsYour capital is at risk.