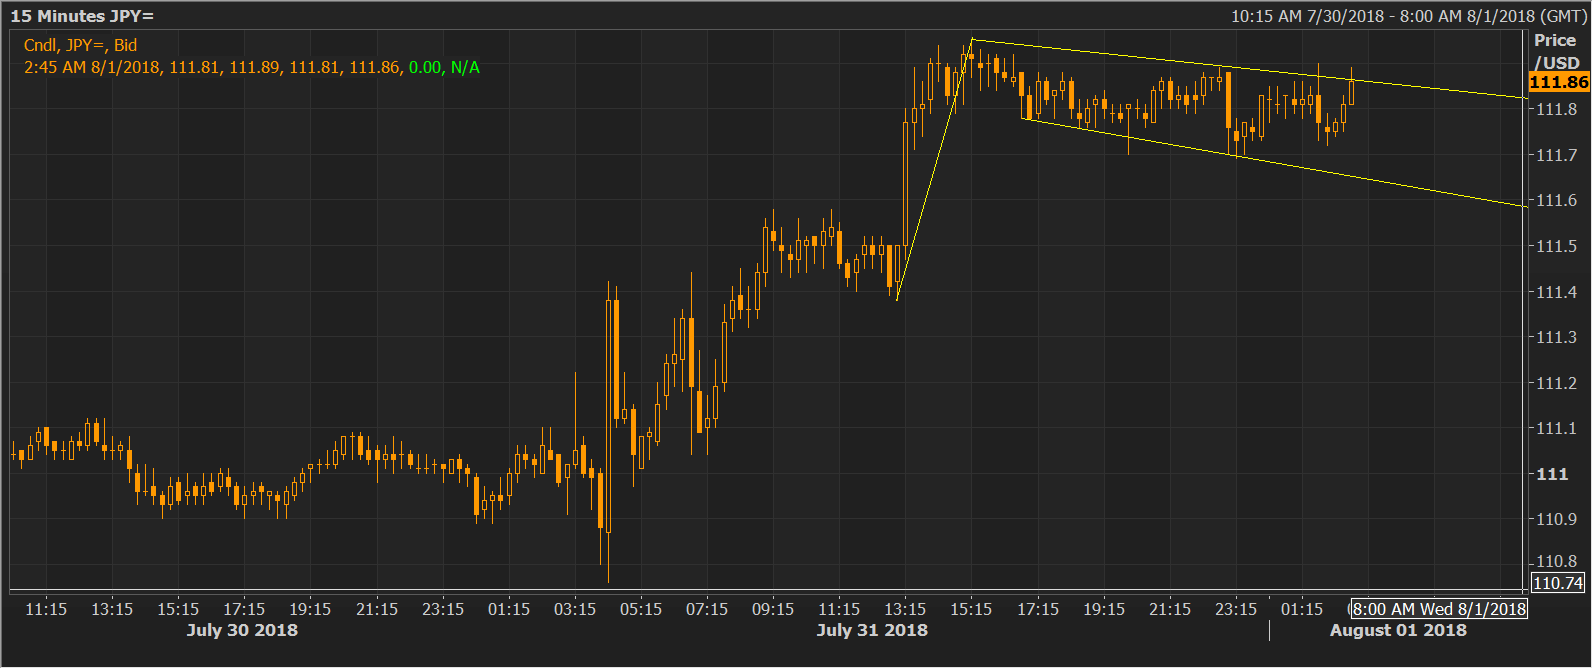
- The USD/JPY has charted a bull flag – a bullish continuation pattern – on the 15-minute chart.
- An upside breakout looks likely and would signal a continuation of the rally from the post-BOJ low of 110.76 and allow a rally to 112.43 (target as per the measured height method).
15-minute chart
Spot Rate: 111.85
Daily High: 111.90
Daily Low: 111.70
Trend: Bullish
R1: 111.86 (flag resistance)
R2: 112.20 (July 15 low resistance as per the hourly chart)
R3: 112.43 (bull flag breakout target)
Support
S1: 111.65 (flag support)
S2: 111.40 (10-day moving average)
S3: 110.62 (50-day moving average)
