- The USD/JPY is trading cautiously near 112.75 in early Friday action after bouncing from the early day’s bottom near 112.56, and the Dollar-Yen pairing is clipping back up today after dropping away from the 113.00 handle in the last twenty-four hours.
USD/JPY, M5
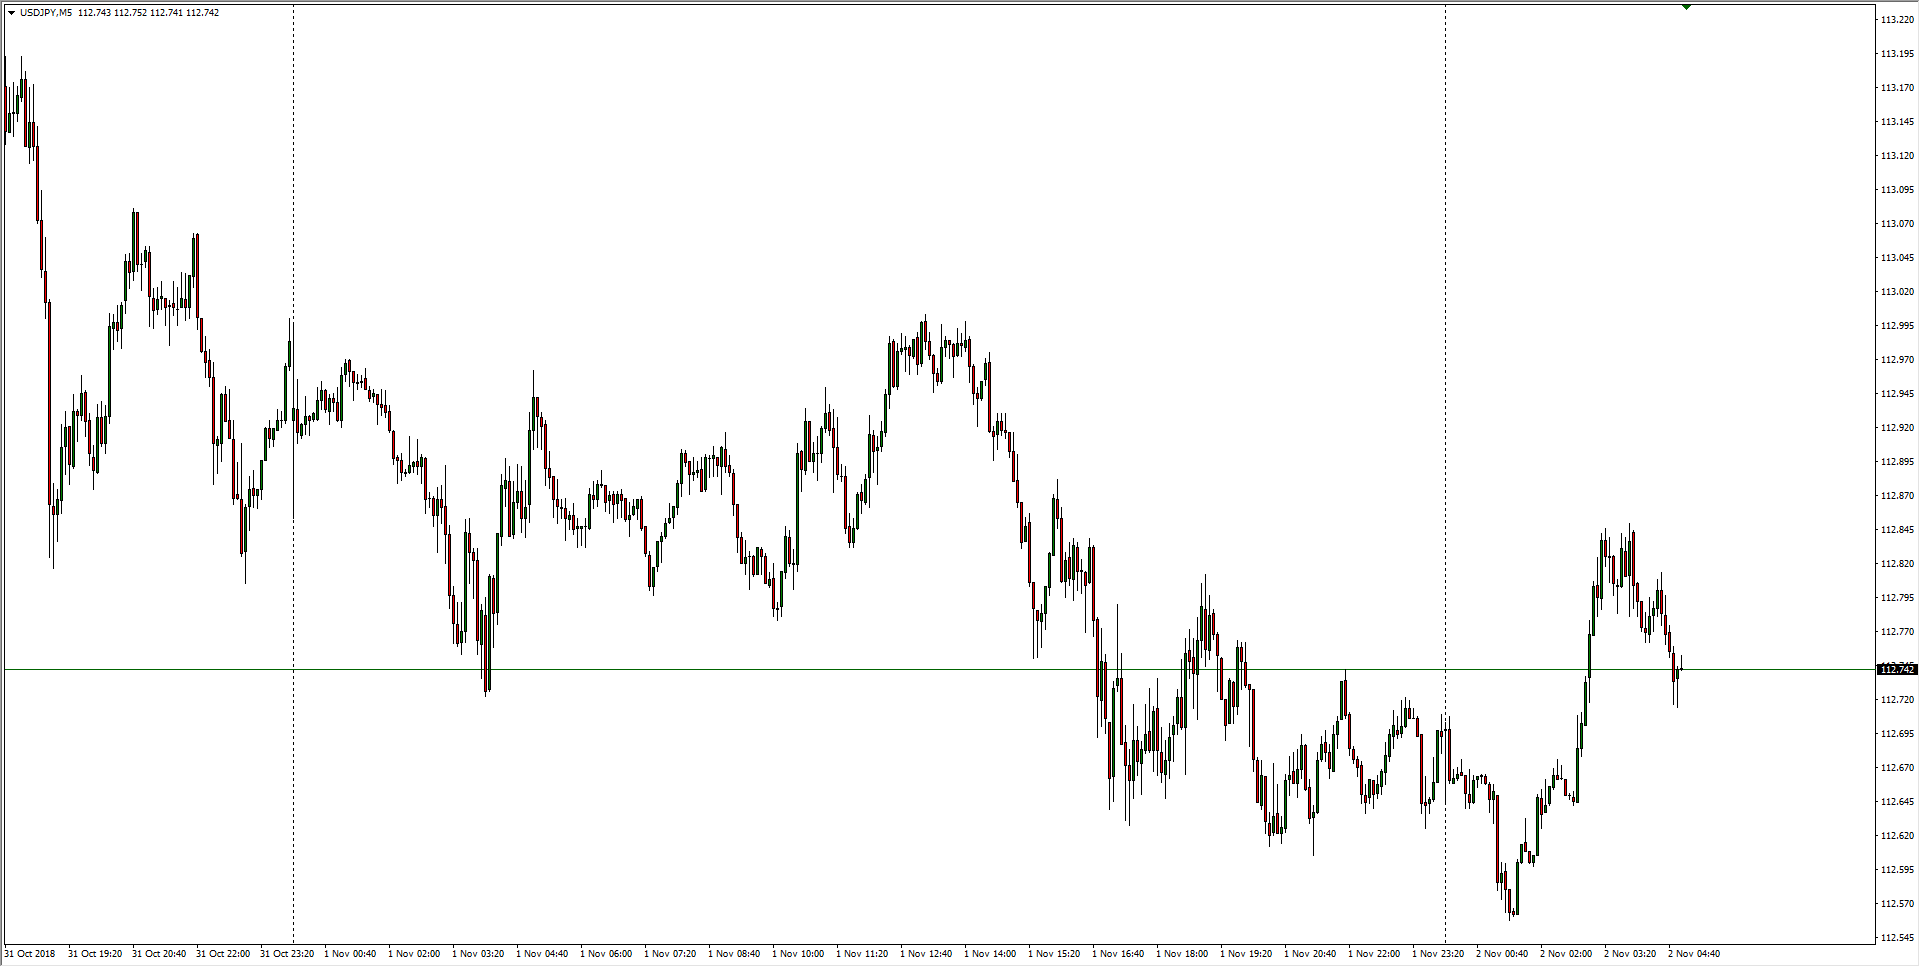
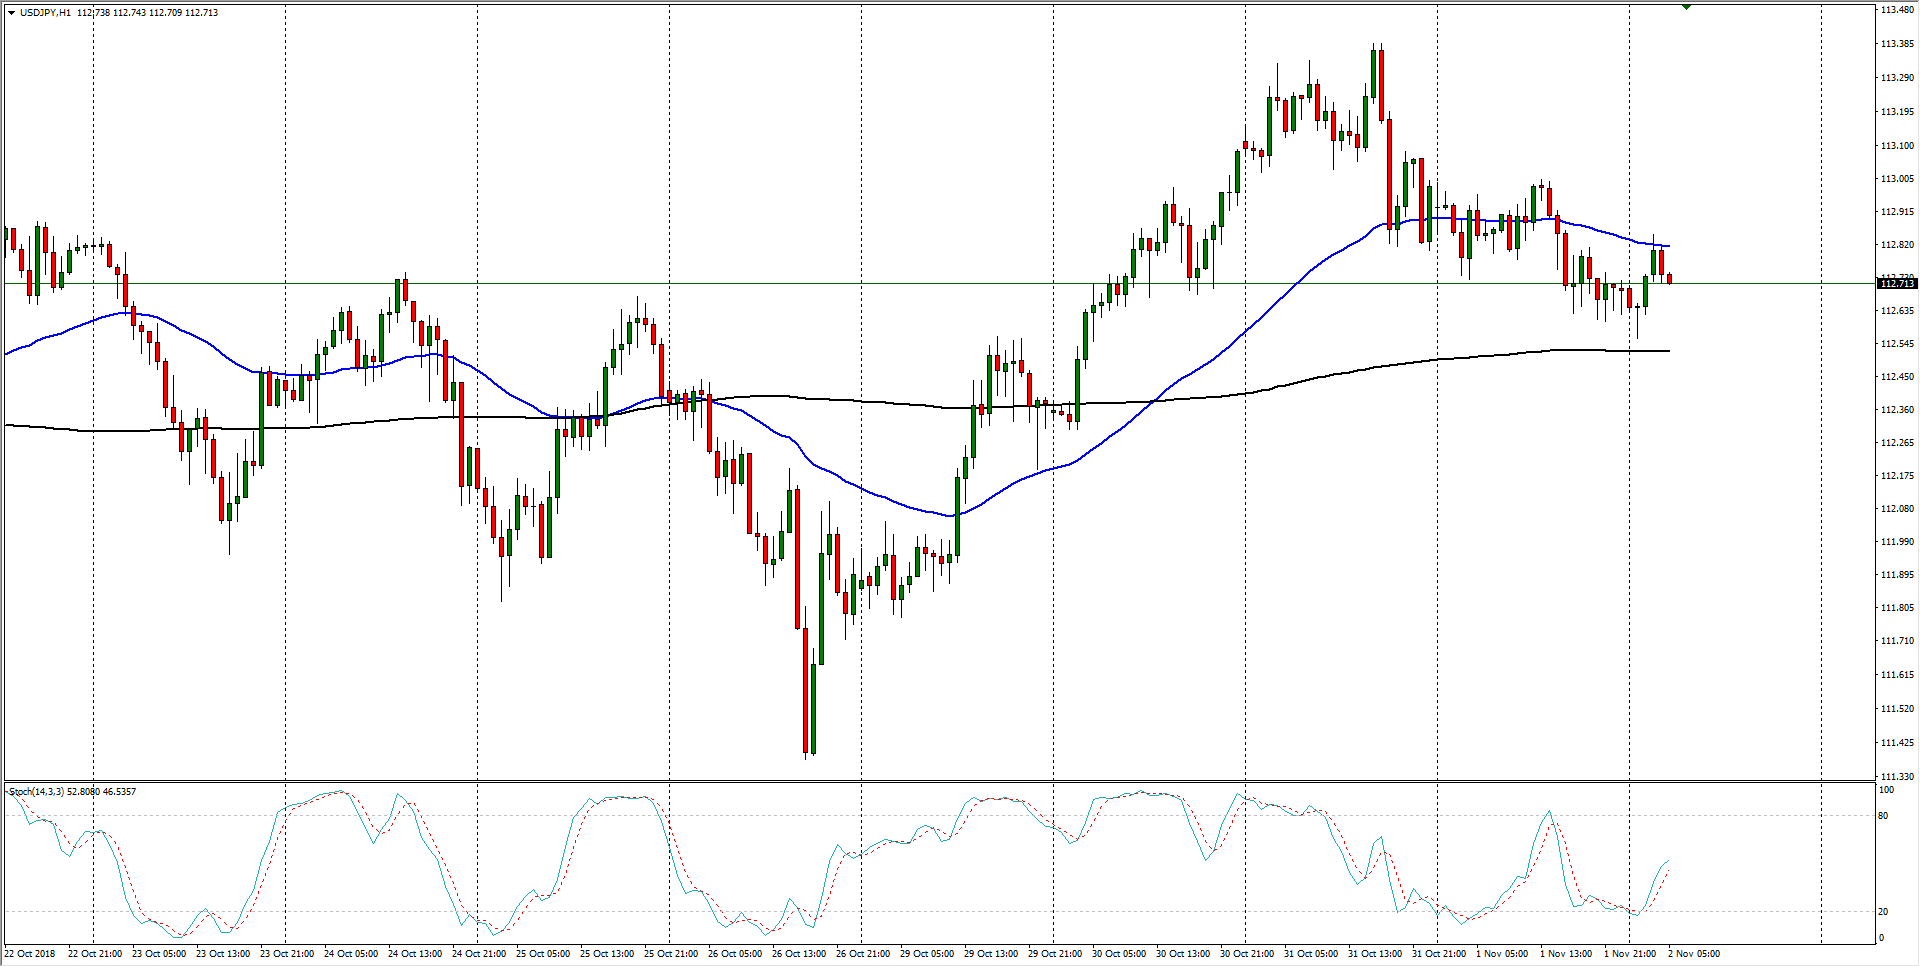
- The Dollar-Yen pairing is beginning to float back into the 200-hour moving average near 112.52, and today’s action is seeing constraint from the 50-hour moving average at 112.80.
USD/JPY, H1
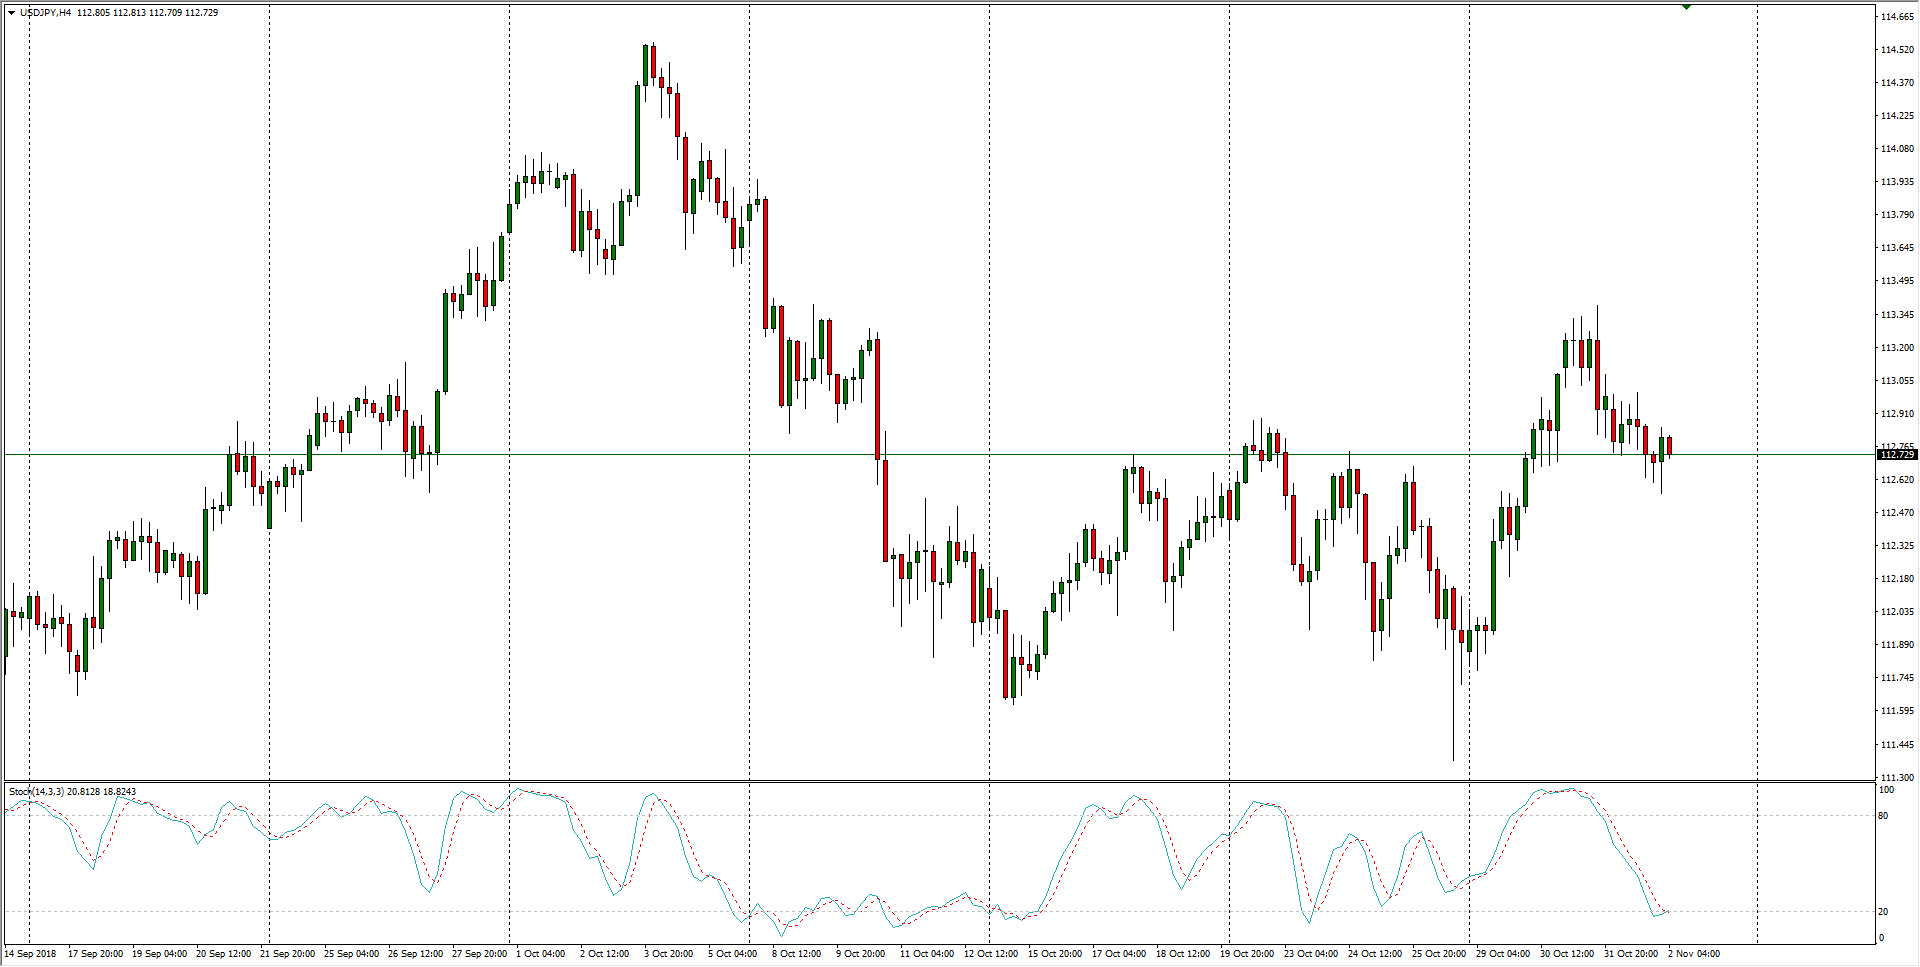
- This past week has seen the USD/JPY break out of recent consolidation, but the pair is drifting back into the top end of its previous zone, and a continued slide in the USD will see falling back into recent trappings.
USD/JPY, H4
USD/JPY
Overview:
Last Price: 112.74
Daily change: 3.0 pips
Daily change: 0.0266%
Daily Open: 112.71
Trends:
Daily SMA20: 112.55
Daily SMA50: 112.3
Daily SMA100: 111.67
Daily SMA200: 109.91
Levels:
Daily High: 113.06
Daily Low: 112.6
Weekly High: 112.9
Weekly Low: 111.38
Monthly High: 114.56
Monthly Low: 111.38
Daily Fibonacci 38.2%: 112.77
Daily Fibonacci 61.8%: 112.88
Daily Pivot Point S1: 112.52
Daily Pivot Point S2: 112.32
Daily Pivot Point S3: 112.05
Daily Pivot Point R1: 112.98
Daily Pivot Point R2: 113.26
Daily Pivot Point R3: 113.45
