- USD/JPY bulls are trying to keep the main bull trend going.
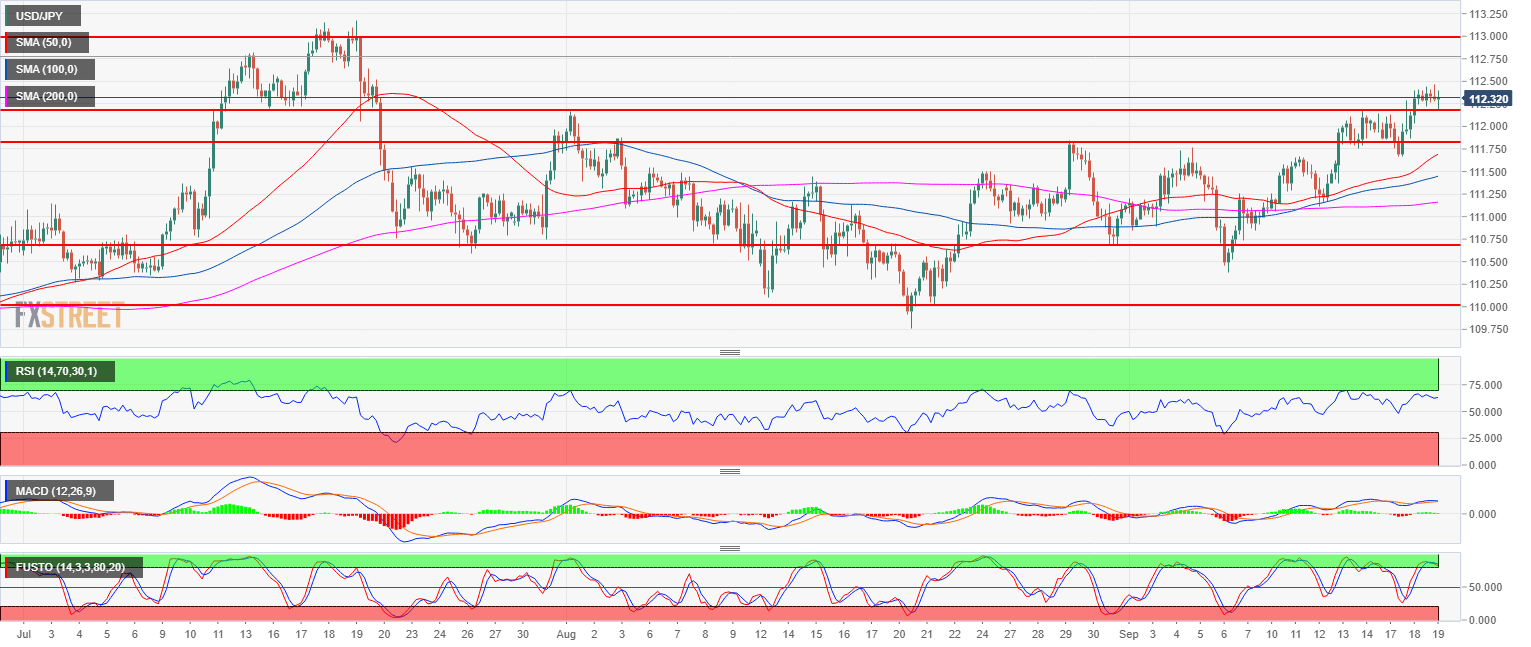
- USD/JPY is trading at weekly highs after finding some resistance just below the 112.50 level. Failure to break above the level can lead to a pullback down towards 111.84 (August 29 swing high) as the RSI and Stochastics indicator are slowly losing steam and not confirming the new high.
- A sustained bull breakout above 112.50 might lead to a continuation up to 113.18 (2018 high).
Spot rate: 112.31
Relative change: -0.05%
High: 112.46
Low: 112.17
Main trend: Bullish
Resistance 1: 112.50 figure
Resistance 2: 113.18, 2018 high
Resistance 3: 114.00 figure
Support 1: 112.00-112.17 zone, figure and August 1, swing high
Support 2: 111.84 August 29 swing high
Support 3: 111.84 August 29 swing high
Support 4: 111.54 August 6, high
Support 5: 111.45 August 8 high
Support 6: 111.00 figure
Support 7: 110.75, July 23 swing low
Support 8: 110.00 figure
Support 9: 109.37 June 25 low
