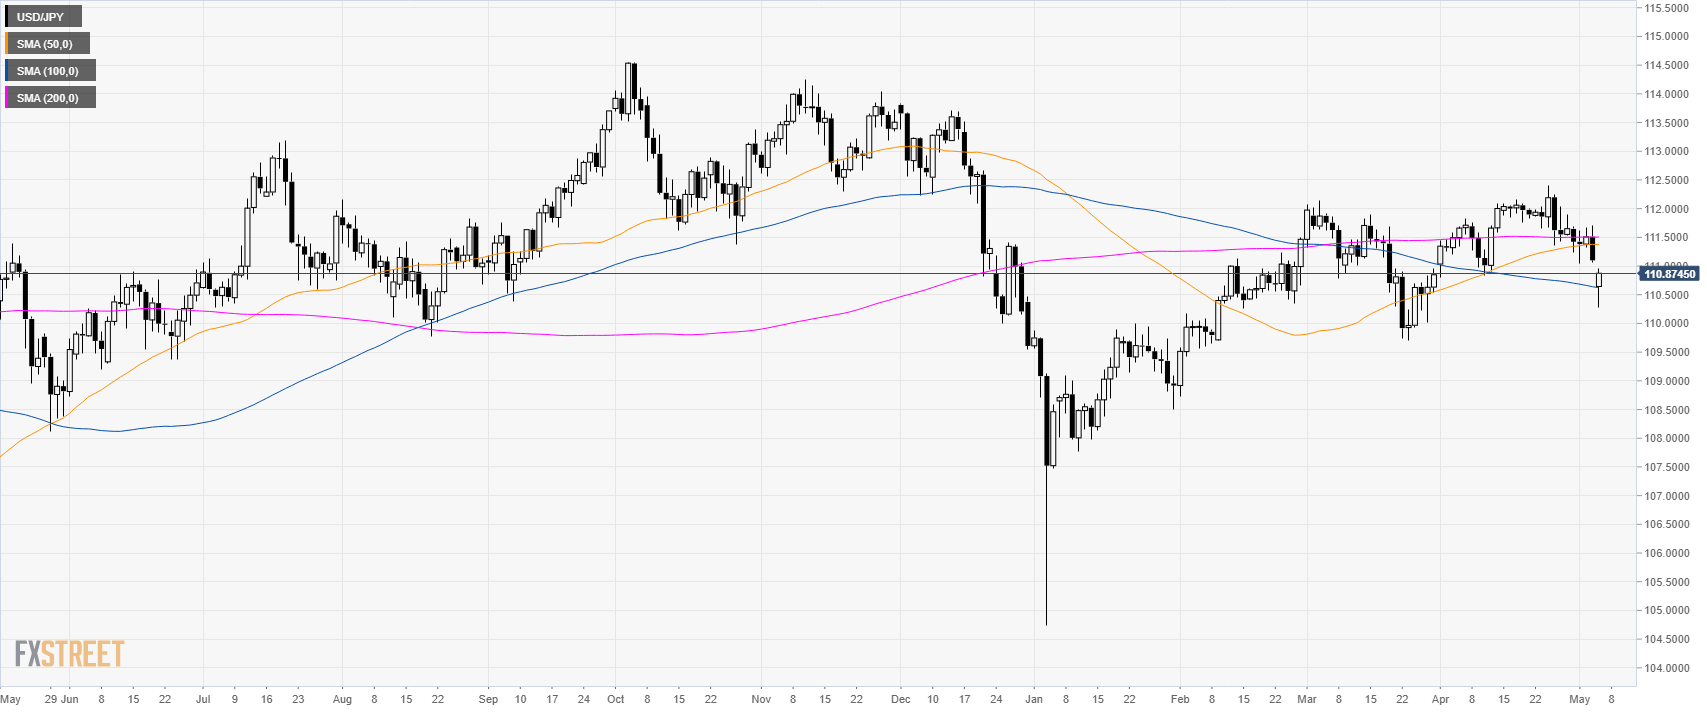
USD/JPY daily chart
- USD/JPY opened Sunday evening with a 44 pip gap down on the back of Sino-American trade concerns.
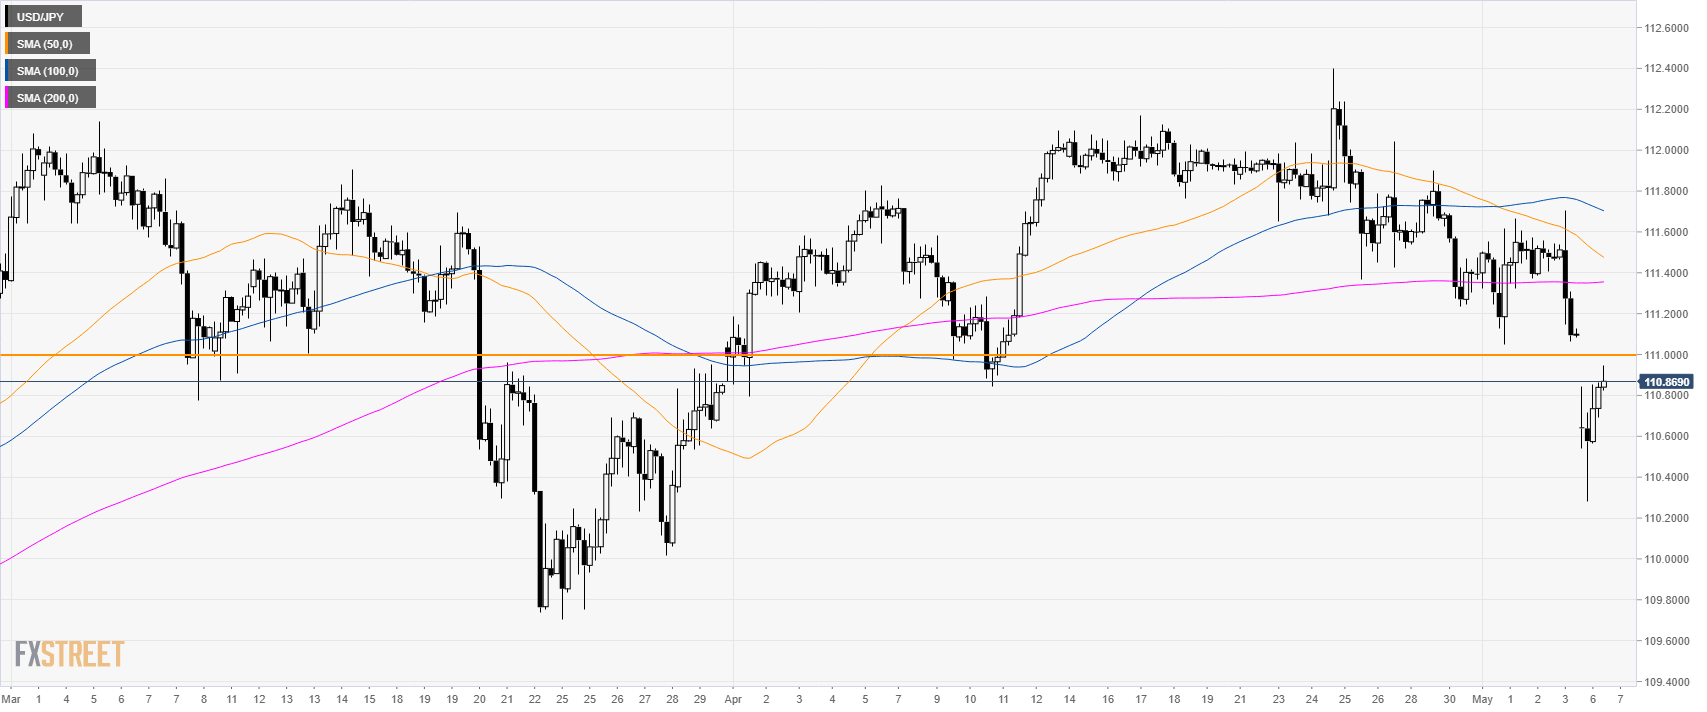
USD/JPY 4-hour chart
- USD/JPY is trading below the 111.00 mark and its main SMAs suggesting a bearish bias in the medium-term.
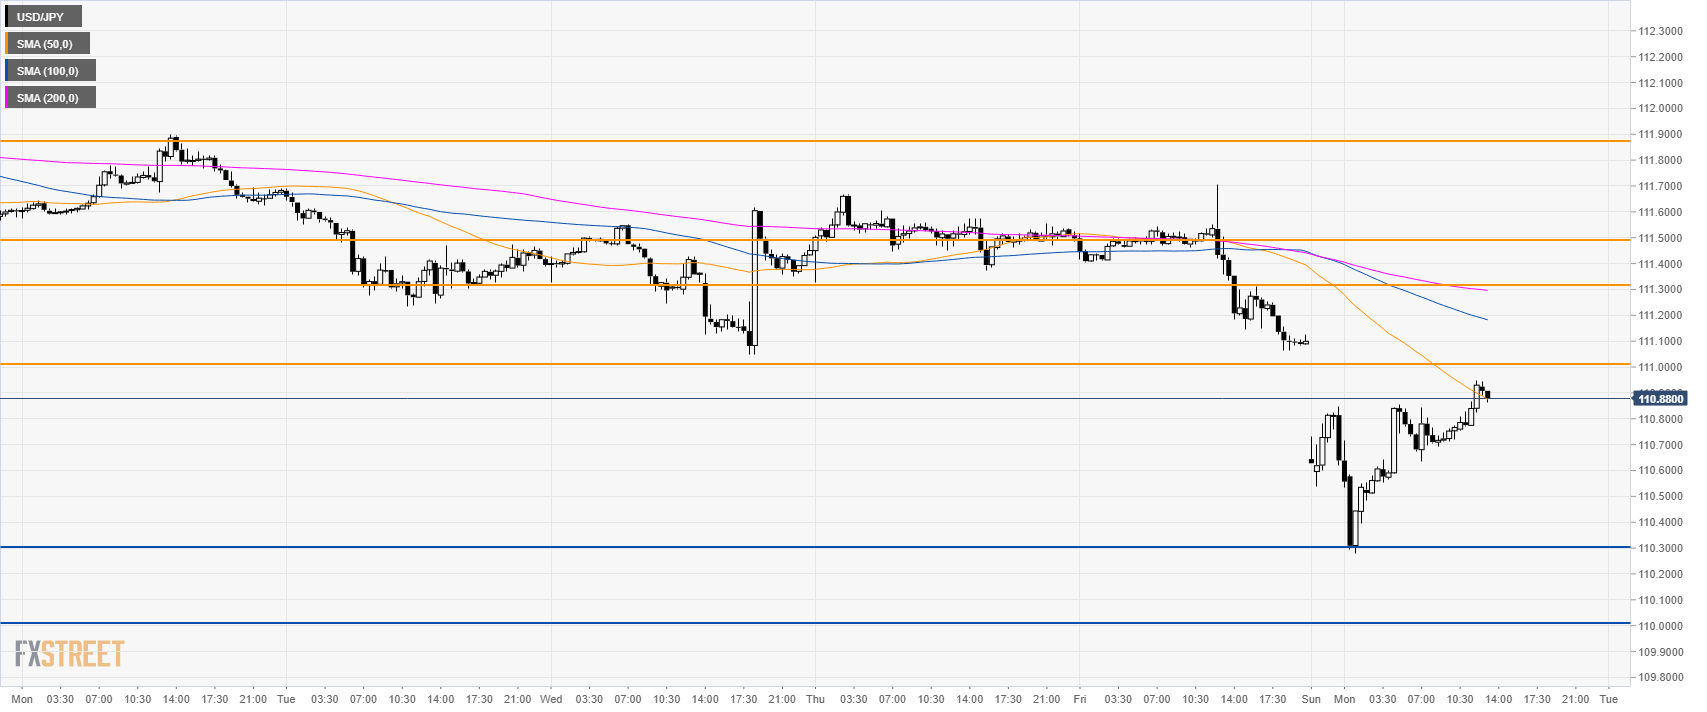
USD/JPY 30-minute chart
- USD/JPY is testing the 50 SMA just below the 111.00 resistance.
- Capped below this level, bears might come back and try to make a retest of 110.30 support and possibly 110.00 figure.
- Resistance is at 111.00, 111.30/50 and 111.90 level.
Additional key levels
