“¢ The pair struggled to build on overnight rebound from two-week lows and met with some fresh supply near 50-hour SMA.
“¢ A follow-through weakness below an important horizontal support now seems to have opened the room for a further near-term downfall.
“¢ Technical indicators on the 1-hourly chart hold in negative territory and reinforce prospects for an extension of last week’s decline from six-month tops.
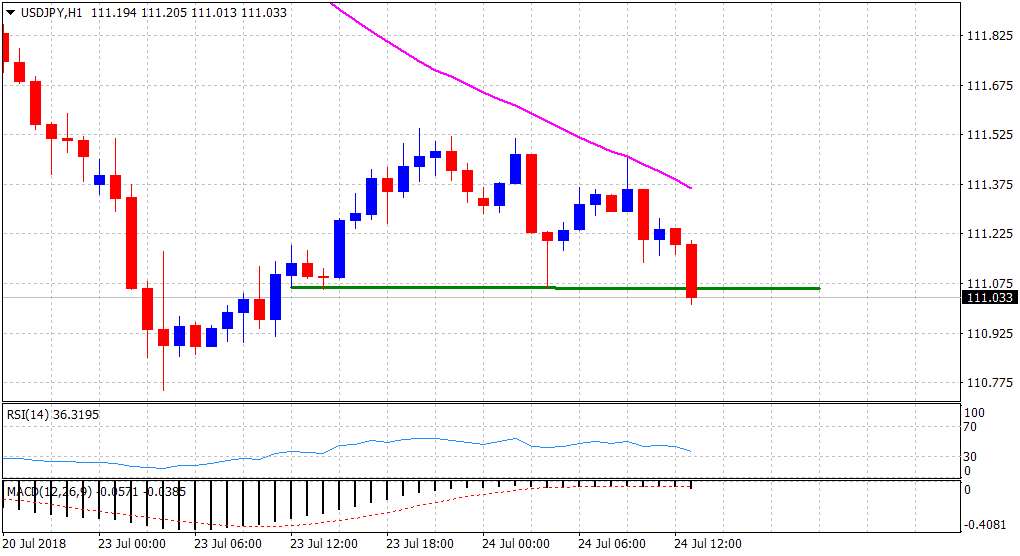
Spot rate: 111.03
Daily High: 111.51
Trend: Bearish
Resistance
R1: 111.33 (50-period SMA H1)
R2: 111.54 (overnight swing high)
R3: 112.03 (R2 daily pivot-point)
Support
S1: 110.75 (2-week lows set in the previous session)
S2: 110.55 (50-day SMA)
S3: 110.07 (S3 daily pivot-point)
