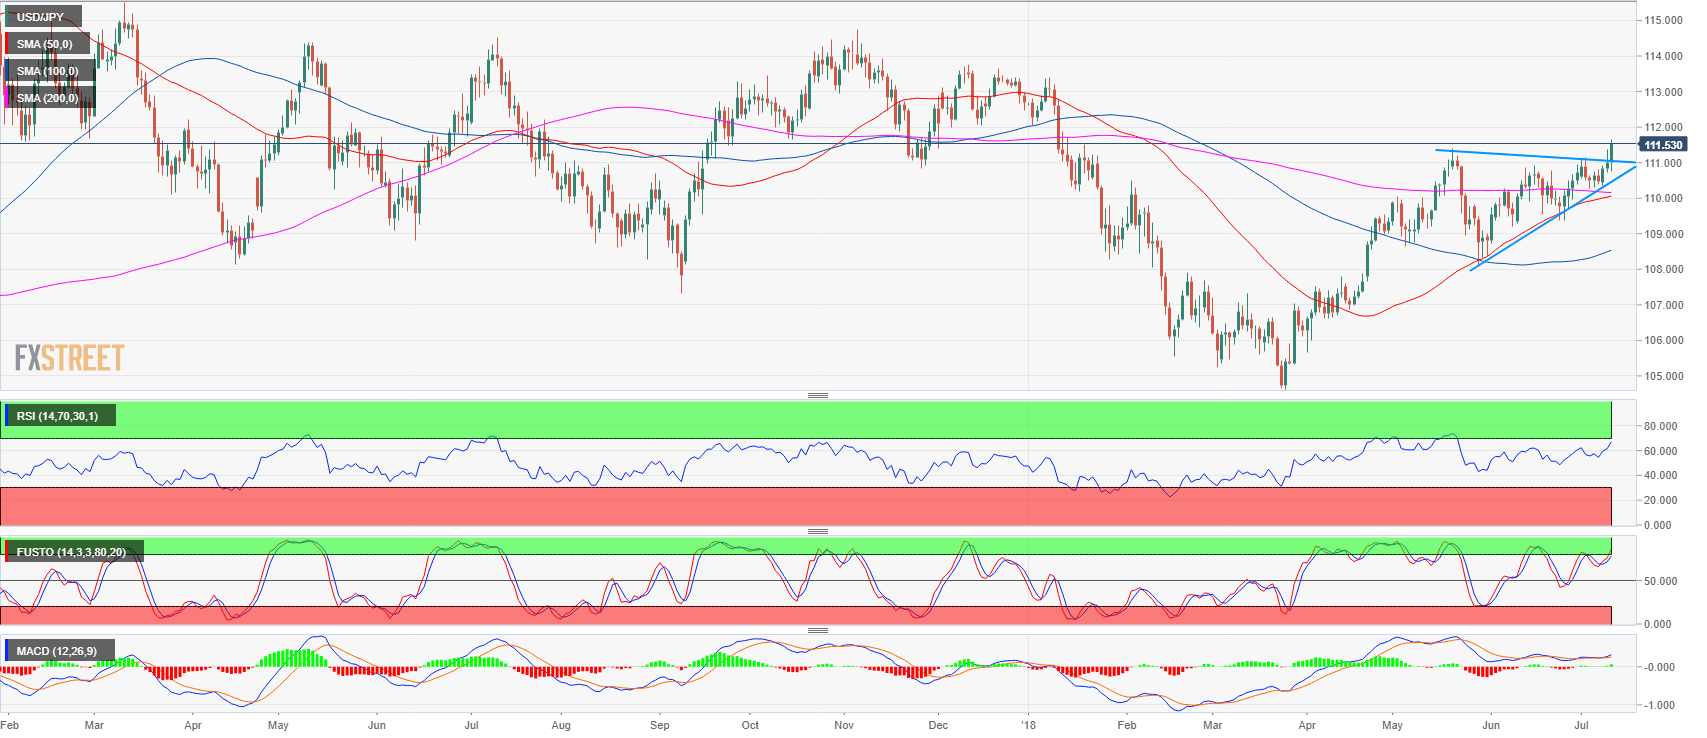
- USD/JPY is trading to levels not seen since January 12 high as the market is breaking out from a triangle formation on the daily chart.
- As USD/JPY is in a strong bull move there should be little resistance in the way up to 112.05 February low, the next key resistance.
- Support can be expected at 111.39 May 21 swing high and in the 111.02-111.16 area, previous intraday swing lows.
-636669208345184413.png)
Spot rate: 111.51
Relative change: 0.46%
High: 111.65
Low: 110.76
Trend: Bullish
Resistance 1: 112.05 February 2 low
Resistance 2: 112.63 January 10 open
Resistance 3: 113.00 figure
Support 1: 111.39 May 21 swing high
Support 2: 111.02-111.16 previous intraday swing lows
Support 3: 110.90 June 15 swing high
Support 4: 110.62-75 supply level and June 21 high
Support 5: 110.40 supply/demand level
Support 6: 110.21 June 22 high
Support 7: 109.90-110.00 area supply level and figure
Support 8: 109.55 June 19 low
USD/JPY daily chart