- USD/JPY main trend is getting damaged as USD/JPY broke below 110.10 swing low.
- USD/JPY is now facing a strong support level in the 109.91-97 area which is comprised of the 200 and 100-day simple moving average. Since USD/JPY has almost reached its average daily range, downside moves appear limited for this Monday.
- A sustained bear breakout below 109.91-97 would confirm a bear continuation move.
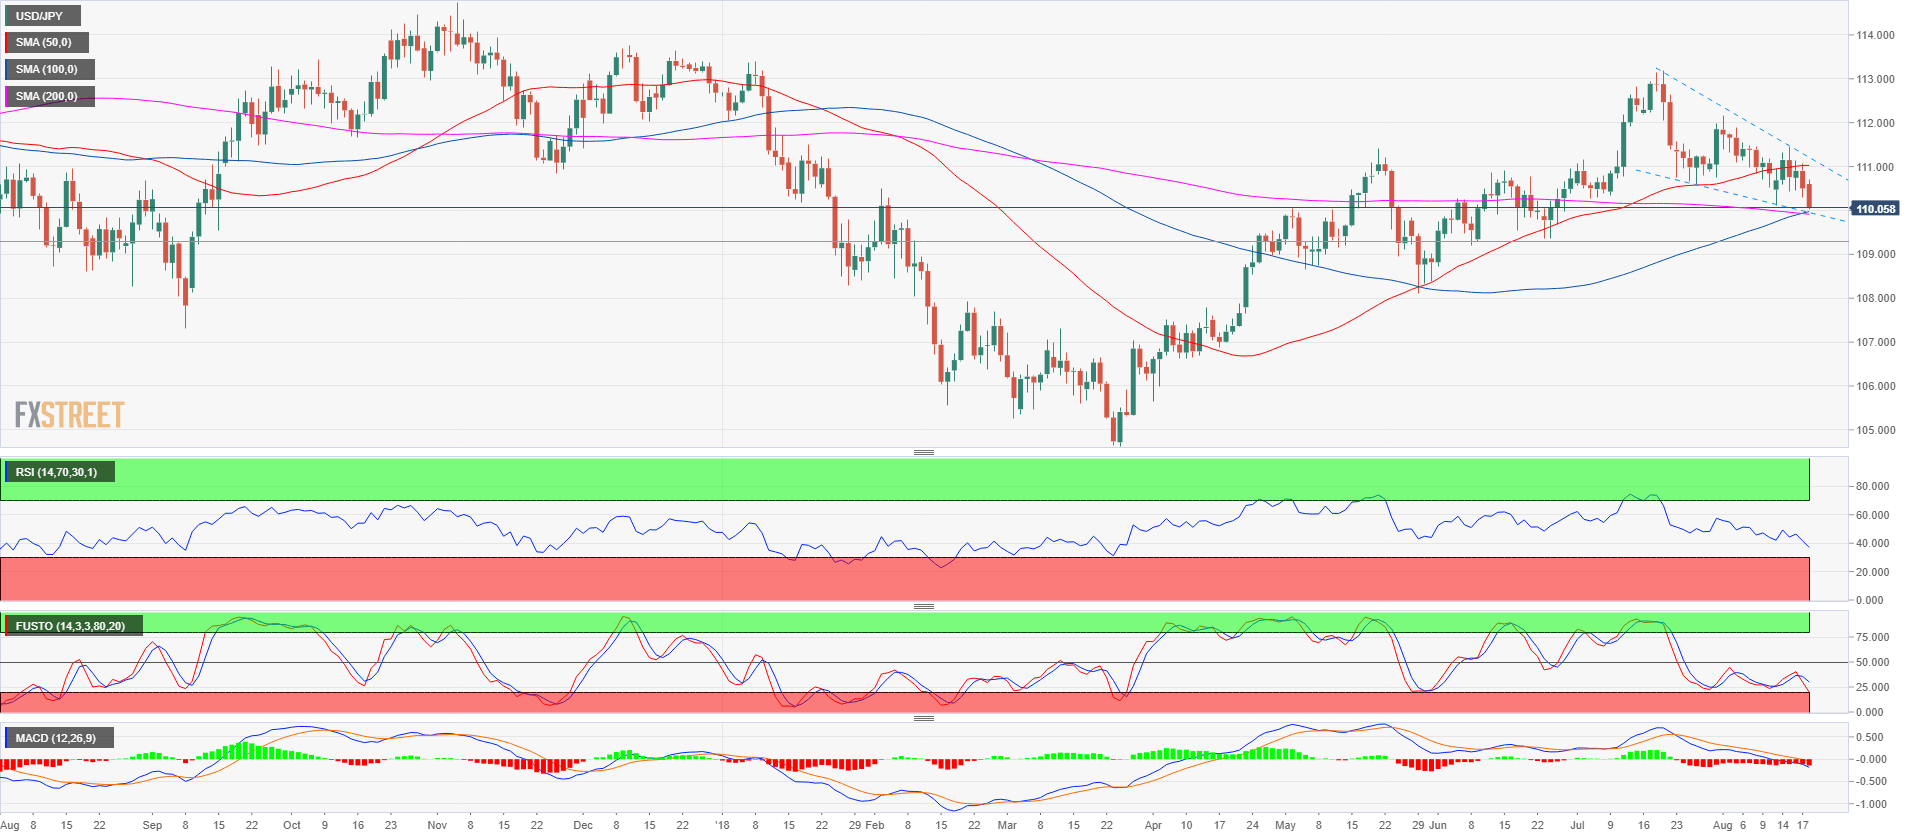
Spot rate: 110.05
Relative change: -0.41%
High: 110.70
Low: 110.01
Main trend: Bullish
Short-term trend Bearish below 110.45
Resistance 1 110.10 August 13 swing low
Resistance 2: 110.40 demand level
Resistance 3: 110.58 July 26 swing low
Resistance 4: 110.75, July 23 low
Resistance 5: 110.90 June 15 swing high
Resistance 6: 111.02-111.16 area, figure and current August 6 low
Resistance 7: 111.45 August 8 high
Resistance 8: 111.54-111.64 area, August 6, high and supply/demand level
Support 1: 109.91-97 area, 200 and 100-day simple moving average
Support 2: 110.10 August 13 swing low
Support 3: 109.37 June 25 swing low
Support 4: 109.19 June 8 low
