- USD/JPY is currently reversing the daily gains after USD/JPY failed to breakout above the 112.19 level.
- USD/JPY momentum is shifting to bearish in the short-term, especially if the market stays below the 111.82-112.00 area. Supports to the downside are seen near the 111.39 May 21 swing high and 111.02-111.16 area, previous intraday swing lows.
- The FOMC statement at 18:00 GMT is likely going to deliver volatility in USD-denominated pairs.
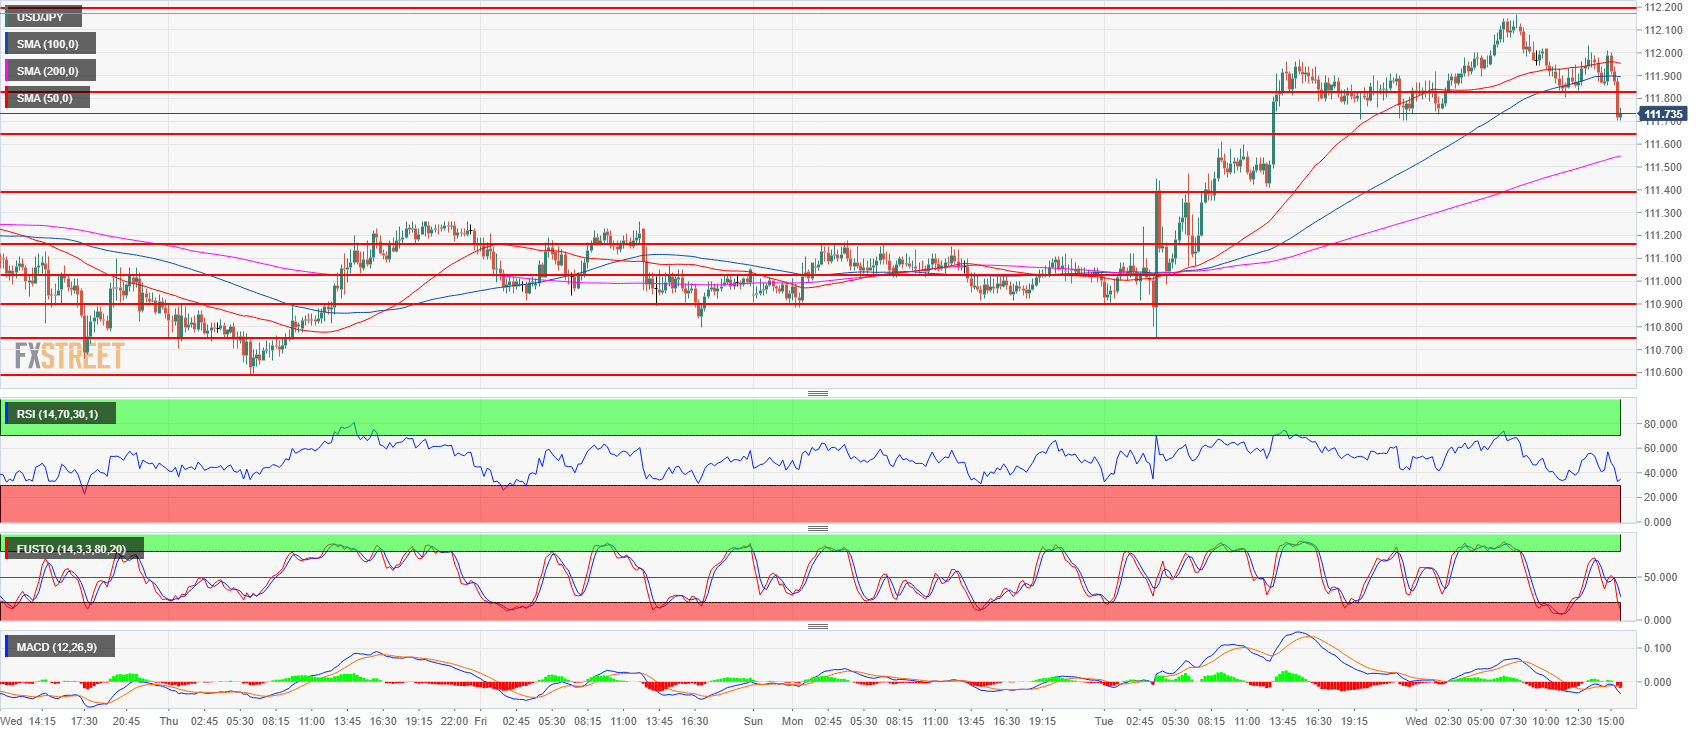
Spot rate: 111.73
Relative change: -0.11%
High: 112.17
Low: 111.70
Trend: Neutral
Resistance 1: 111.82-112.00 area, supply level and figure
Resistance 2: 112.19-112.40 area, July 11 high and intraday swing low
Resistance 3: 112.64 July 12 high
Resistance 4: 113.18, 2018 high
Resistance 5: 113.26-113.38, 200-weekly simple moving average and January 8 high
Resistance 6: 114.45 October 27, 2017 high
Support 1: 111.64 supply/demand level
Support 2: 111.39 May 21 swing high
Support 3: 111.02-111.16 area previous intraday swing lows
Support 4: 110.90 June 15 swing high
Support 5: 110.75, July 23 low
Support 6: 110.58 July 26 low
Support 7: 110.27 July 4 low
