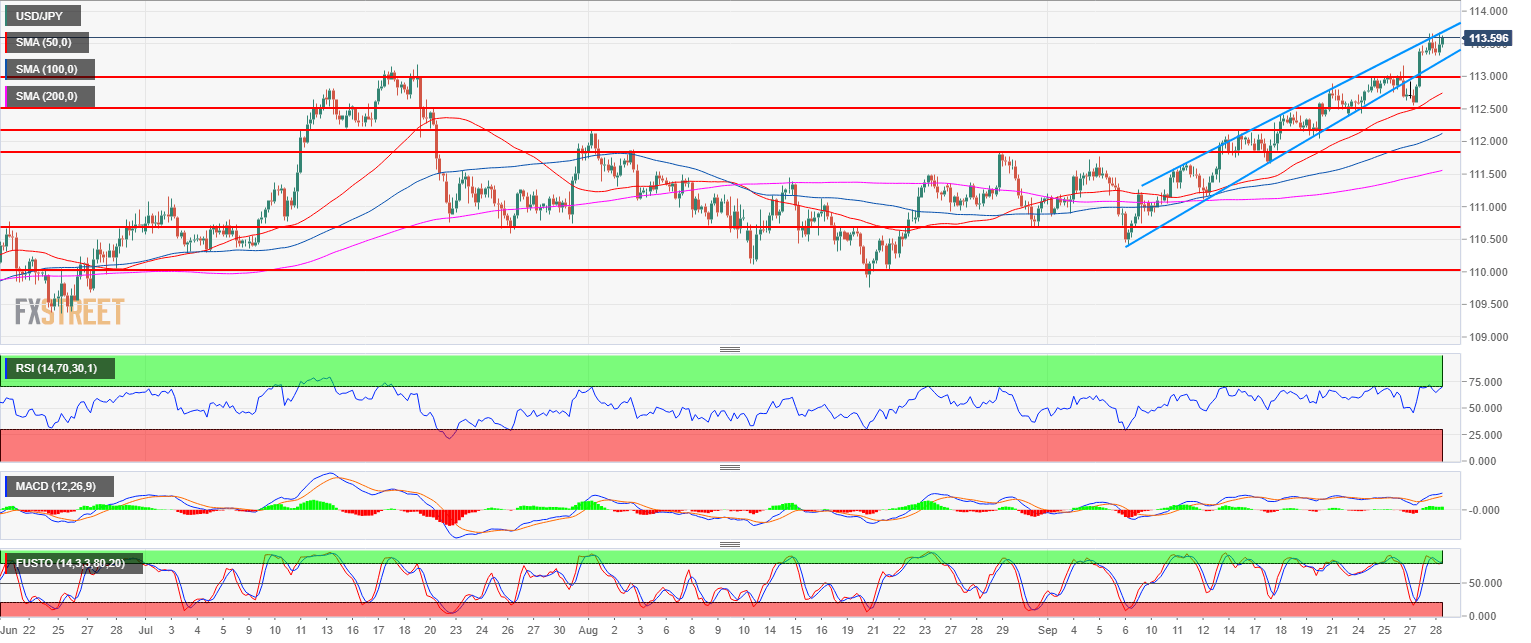
- USD/JPY main bull trend is intact as the bulls have surpassed the 200-weekly simple moving average.
- USD/JPY is trading above its 50, 100 and 200-period simple moving averages which are rising and widening suggesting strong bullish momentum. The next target to the upside are likely located near 114.00 figure and 114.80 (November 2017 high).
- A bear breakout below 112.50 would likely invalidate the current bullish bias.
Spot rate: 113.58
Relative change: 0.19%
High: 113.68
Low: 113.31
Main trend: Bullish
Resistance 1: 114.00 figure
Resistance 2: 114.80 November 2017 high
Resistance 3: 115.50 March 10, 2017
Support 1: 113.18, July high
Support 2: 112.50 figure
Support 3: 112.00-112.17 zone, figure and August 1 swing high
Support 4: 111.84 August 29 swing high
