- USD/JPY main trend is on hold since July, 19 as the market is in a triangle consolidation.
- USD/JPY found resistance at the 50-day simple moving average. The market is now trading at its lowest in the last three days as bears are targeting 110.10 August 13 swing low and the trendline.
- A bull breakout above 111.45 swing high would negate the short-term bearish bias.
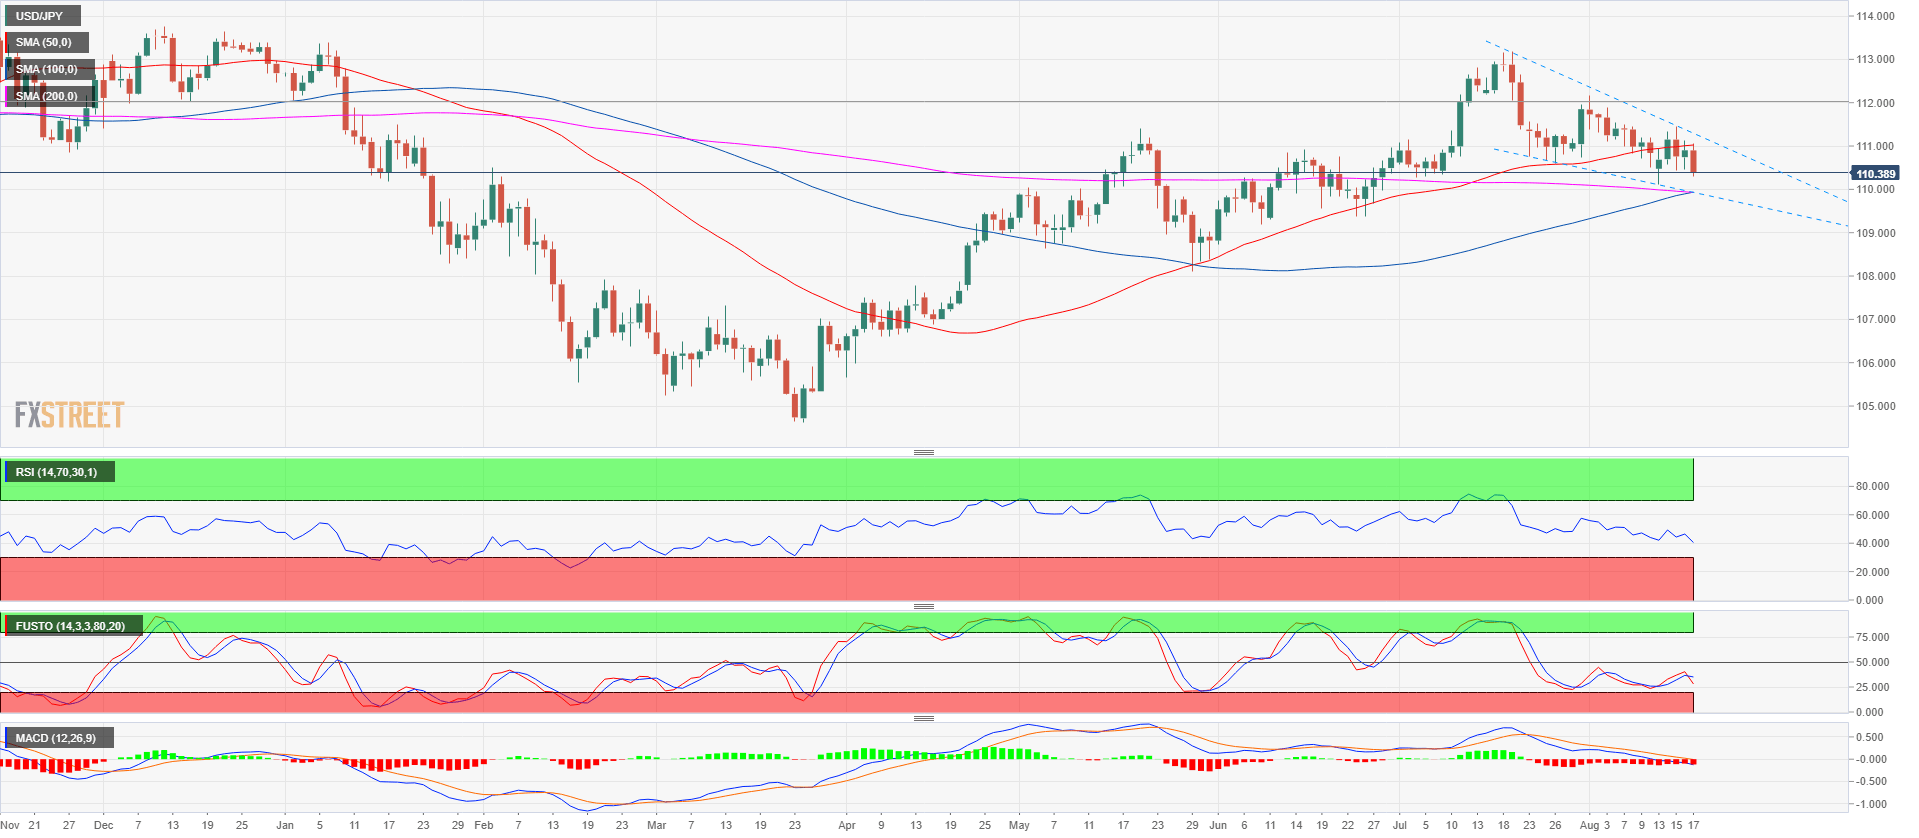
Spot rate: 110.36
Relative change: -0.48%
High: 111.07
Low: 110.30
Main trend: Bullish
Short-term trend Bearish below 110.45
Resistance 1: 110.58 July 26 swing low
Resistance 2: 110.75, July 23 low
Resistance 3: 110.90 June 15 swing high
Resistance 4: 111.02-111.16 area, figure and current August 6 low
Resistance 5: 111.45 August 8 high
Resistance 6: 111.54-111.64 area, August 6, high and supply/demand level
Support 1: 110.40 demand level
Support 2: 110.10 August 13 swing low
Support 3: 109.37 June 25 swing low
Support 4: 109.19 June 8 low
