- USD/JPY bulls want to extend the main bull trend but they have found resistance at the 113.00 figure.
- The 50, 100 and 200-period simple moving average are rising and widening suggesting bullish momentum. However, USD/JPY found resistance at the 113.00 psychological figure and broke below the bull trendline. The RSI an Stochastics indicator are pointing down.
- While the main trend is up, the market seems ripe for a pullback down towards 112.50 and 112.00 figure.
USD/JPY 4-hour chart
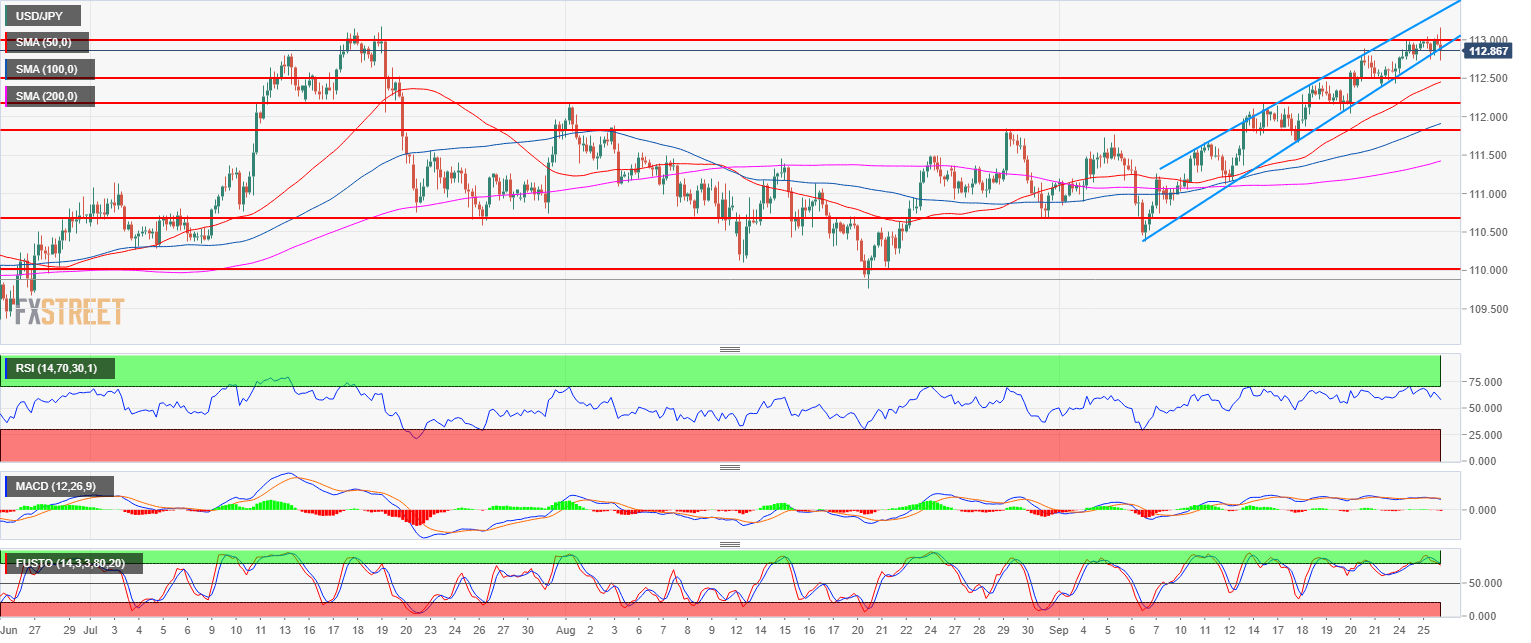
Spot rate: 112.88
Relative change: -0.08%
High: 113.16
Low: 112.73
Main trend: Bullish
Short-term trend: Bearish below 113.00
Resistance 1: 113.18, July high
Resistance 2: 114.00 figure
Resistance 3: 114.80 November 2017 high
Support 1: 112.50 figure
Support 2: 112.00-112.17 zone, figure and August 1, swing high
Support 3: 111.84 August 29 swing high
Support 4: 111.84 August 29 swing high
Support 5: 111.54 August 6, high
Support 6: 111.45 August 8 high
Support 7: 111.00 figure
Support 8: 110.75, July 23 swing low
Support 9: 110.00 figure
Support 10: 109.37 June 25 low
