- USD/JPY is currently in sideways consolidation mode after the currency pair lost about 250 pips since last week.
- USD/JPY is currently attempting to form a base in the 110.60-111.60 range. The simple moving averages (SMA) are rather flat with the 50-period SMA about to cross the 100-period SMA suggesting that USD/JPY is slowly gaining some bullish traction.
- However, neither sides are generating convincing directional moves. Bulls would need to breakout above the 111.60 level in order to get an advantage while bears are currently selling the intraday rally at the 111.20 level near the daily high.
USD/JPY 15-minute chart
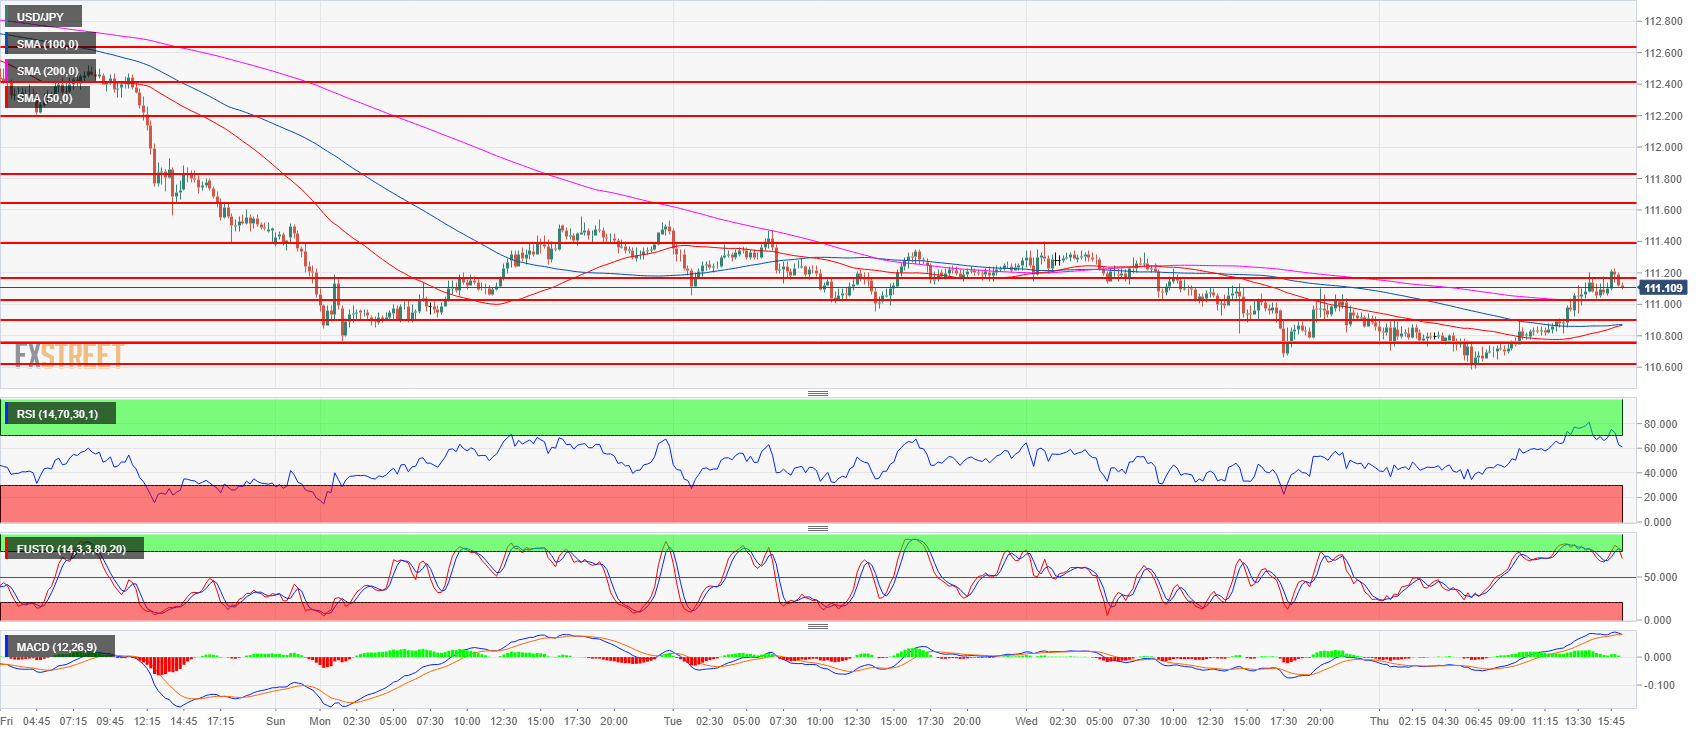
Spot rate: 111.12
Relative change: 0.11%
High: 111.23
Low: 110.58
Trend: Neutral
Resistance 1: 111.23 current July 26 high
Resistance 2: 111.39 May 21 swing high
Resistance 3: 111.60-111.80 area, 23.6% and 38.2% Fibonacci retracement low/high July 11
Resistance 4: 112.19-112.40 area, July 11 high and intraday swing low
Resistance 5: 112.64 July 12 high
Resistance 6: 113.18, 2018 high
Resistance 7: 113.26-113.38, 200-weekly simple moving average and January 8 high
Resistance 8: 114.45 October 27, 2017 high
Support 1: 111.02-111.16 previous intraday swing lows
Support 2: 110.75-110.90, July 23 low and June 15 swing high
Support 3: 110.27 July 4 low
