- USD/JPY is trading at weekly highs as it testing the current 2018 high at 112.82.
- USD/JPY bull trend remains intact and if bulls can break above 112.82, the 2018 high, then the next targets become 113.38 January 8 high and 114.45 October 27, 2017 high.
- Supports are located near 112.64 July 12 high and 112.-19-112.40 area.
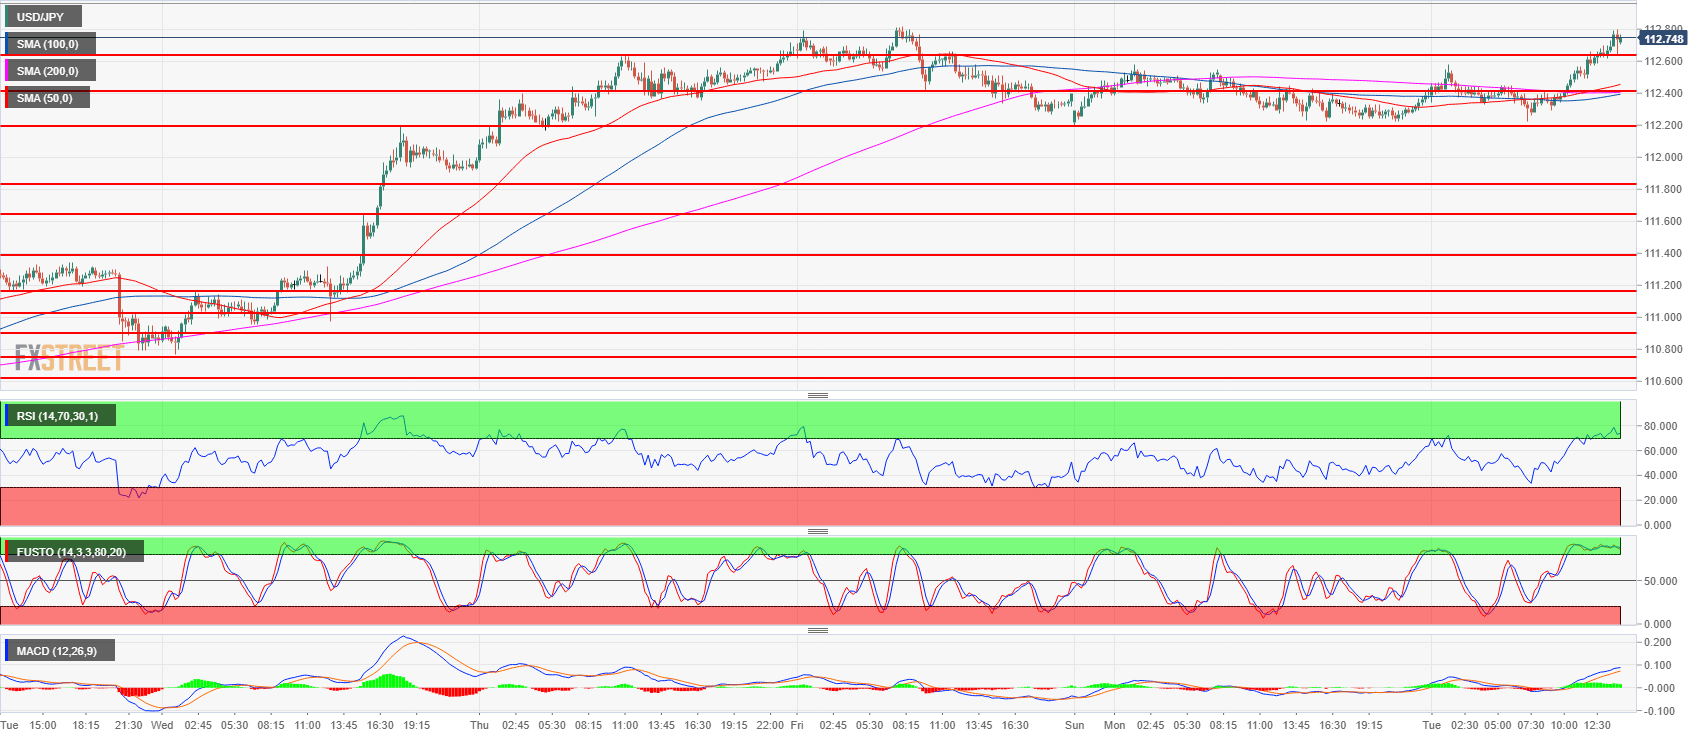
Spot rate: 112.74
Relative change: 0.40%
High: 112.80
Low: 112.22
Trend: Bullish
Resistance 1: 112.82, 2018 high
Resistance 2: 113.38 January 8 high
Resistance 3: 114.45 October 27, 2017 high
Support 1: 112.64 July 12 high
Support 2: 112.19-112.40 area, July 11 high and intraday swing low
Support 3: 111.60-111.80 area, 23.6% and 23.2% Fibonacci retracement low/high July 11
Support 4: 111.39 May 21 swing high
Support 5: 111.02-111.16 previous intraday swing lows
Support 6: 110.90 June 15 swing high
