- USD/JPY printed a new 2018 high this Thursday at 113.18 although it was only a few pips above yesterday’s high.
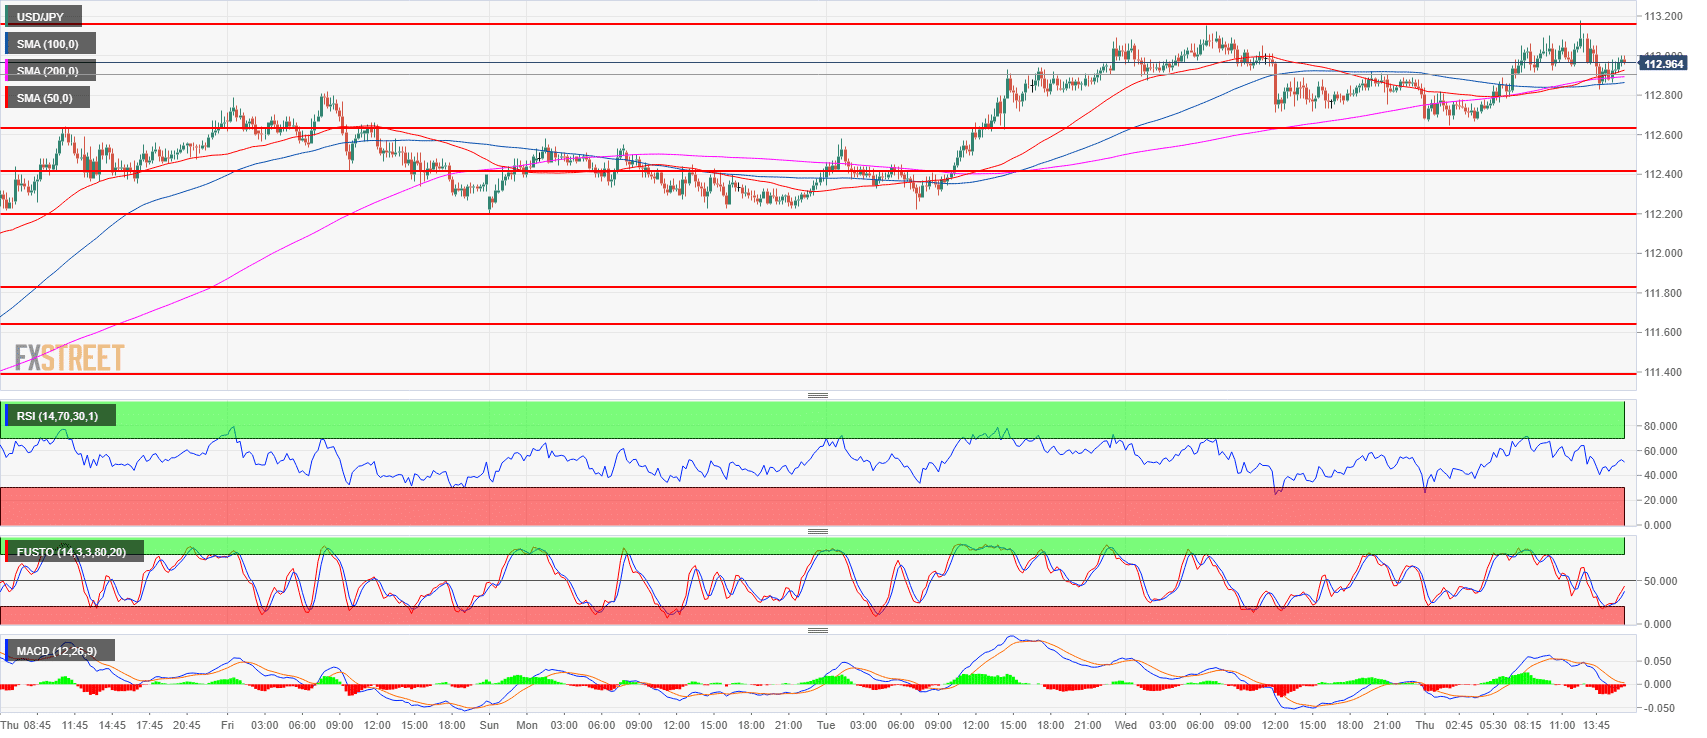
- USD/JPY is grinder higher supported by the rising 50, 100 and 200-period simple moving averages.
- USD/JPY is trying to regain the daily highs but seems to be running out of steam ahead of the 113.00 figure. Main supports are seen near 112.64 July 12 high and 112.19-112.40 area, July 11 high and intraday swing low. Resistances to the upside are likely located near 113.18, the 2018 high followed by 113.26-113.38 area, 200-weekly simple moving average and January 8 high.
USD/JPY 15-minute chart
Spot rate: 112.97
Relative change: 0.09%
High: 113.18
Low: 112.64
Trend: Bullish
Resistance 1: 113.18, 2018 high
Resistance 2: 113.26-113.38, 200-weekly simple moving average and January 8 high
Resistance 3: 114.45 October 27, 2017 high
Support 1: 112.64 July 12 high
Support 2: 112.19-112.40 area, July 11 high and intraday swing low
Support 3: 111.60-111.80 area, 23.6% and 23.2% Fibonacci retracement low/high July 11
Support 4: 111.39 May 21 swing high
Support 5: 111.02-111.16 previous intraday swing lows
Support 6: 110.90 June 15 swing high
