- USD/JPY has been unable to regain the 111.82-112.00 area as the 50-period simple moving average crossed below the 200 SMA suggesting a mild bearish bias.
- On the flip side, bears have been unable to break below 111.39 Wednesday’s low. Bears need to breakout below this level in order to extend the bear leg. Failure to do so could lead to a retest of the 111.64 level and a resumption of the bull trend.
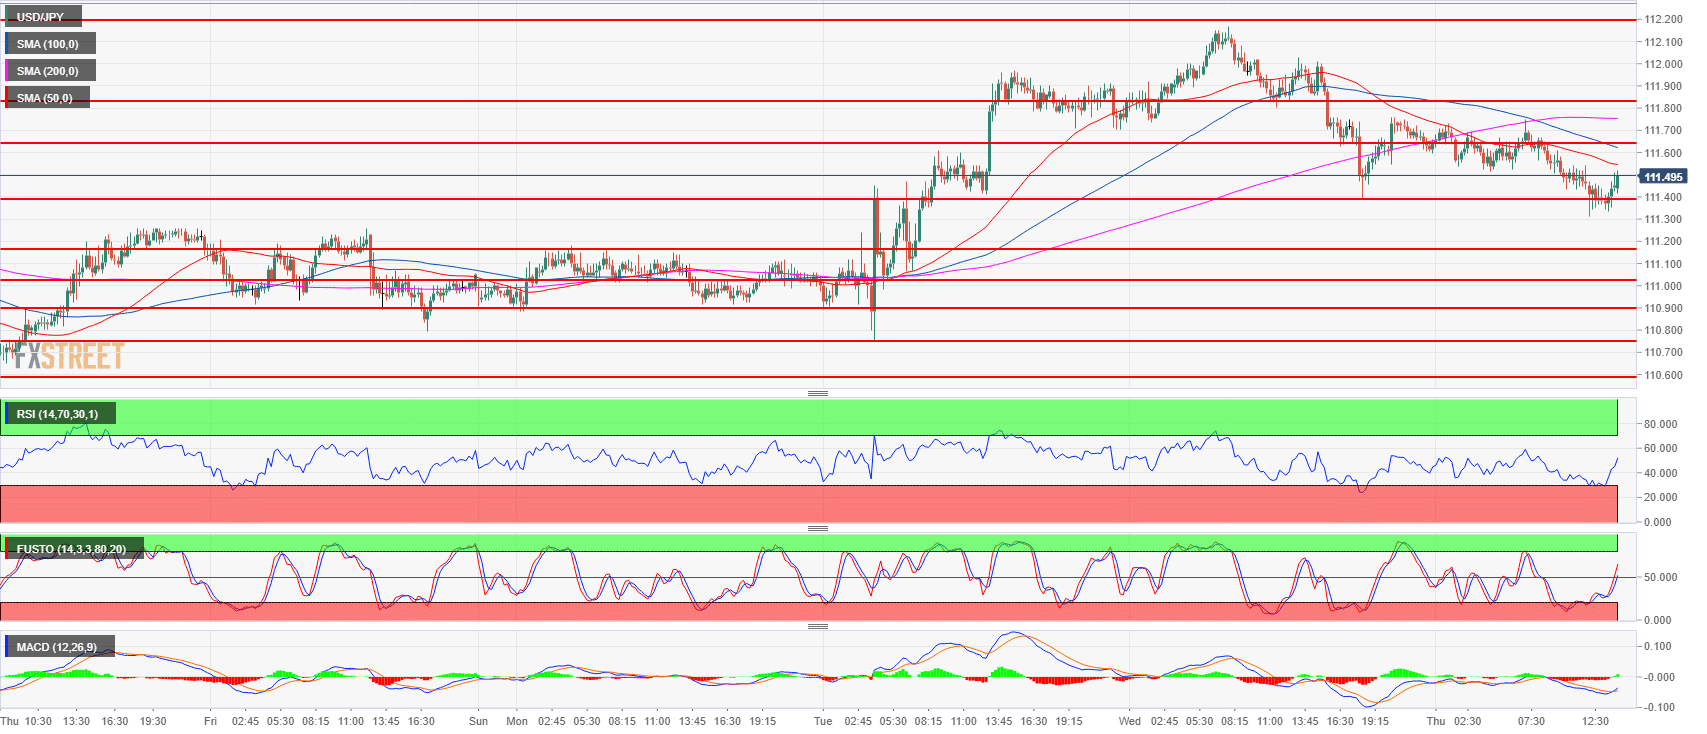
Spot rate: 111.49
Relative change: -0.21%
High: 111.75
Low: 111.31
Trend: Bullish / Bearish reversal risk below 111.82-112.00
Resistance 1: 111.64 supply/demand level
Resistance 2: 111.82-112.00 area, supply level and figure
Resistance 3: 112.19-112.40 area, July 11 high and intraday swing low
Resistance 4: 112.64 July 12 high
Resistance 5: 113.18, 2018 high
Resistance 6: 113.26-113.38, 200-weekly simple moving average and January 8 high
Resistance 7: 114.45 October 27, 2017 high
Support 1: 111.39 May 21 swing high
Support 2: 111.02-111.16 area previous intraday swing lows
Support 3: 110.90 June 15 swing high
Support 4: 110.75, July 23 low
Support 5: 110.58 July 26 low
Support 6: 110.27 July 4 low
