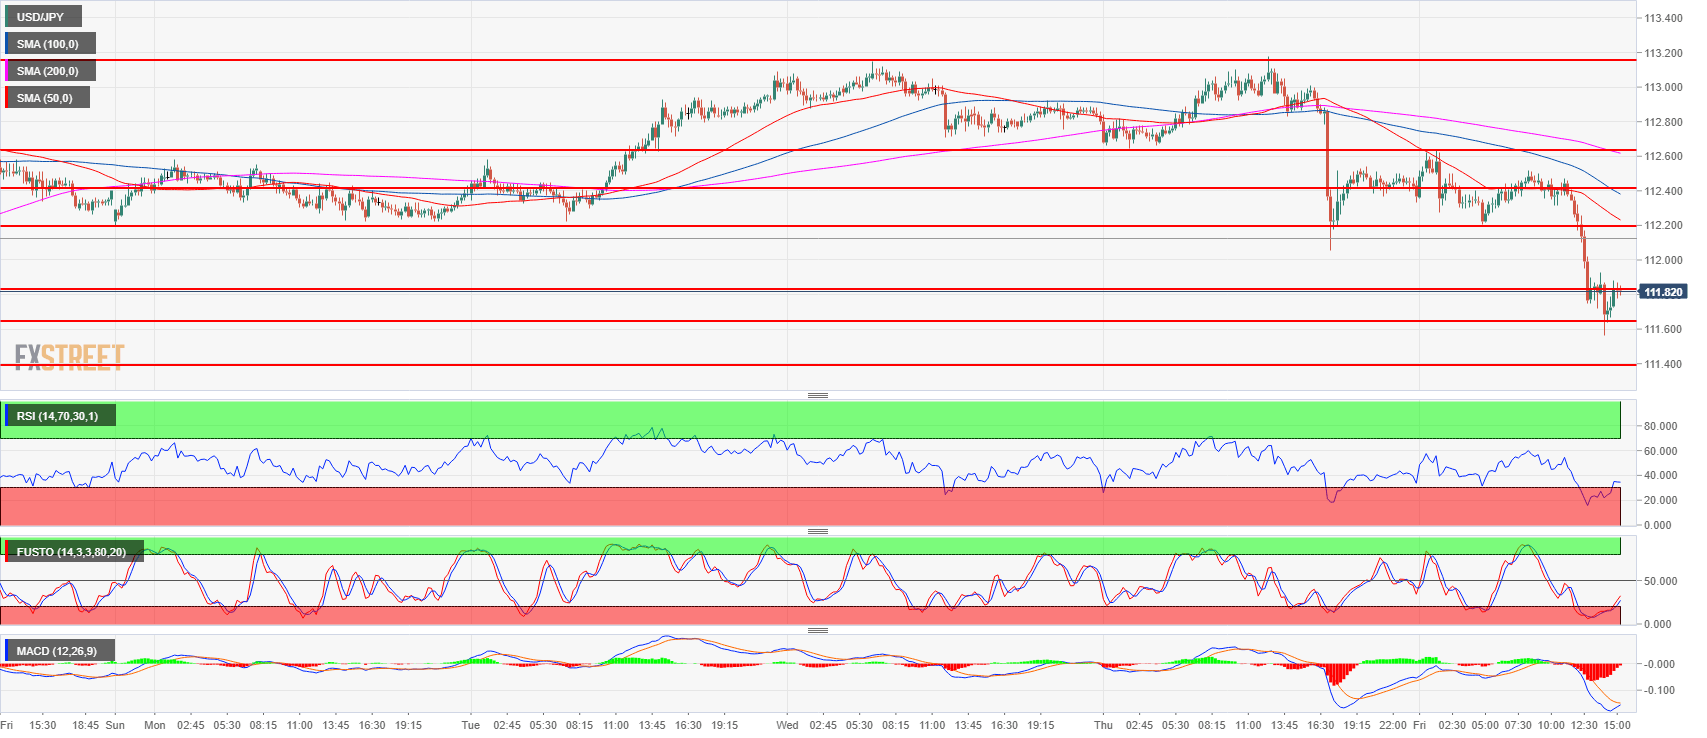
- USD/JPY continued the fall initiated on Thursday as it has now found support at the 111.60-111.80 area.
- As the current bearish momentum is rather strong, the correction might extend some more, potentially to 111.39 May 21 swing high. Resistances are seen near the 112.19-112.40 area and 112.64 July 12 high.
- US President Trump criticized interest rate hikes in the last two days and it hurt the USD.
Spot rate: 111.80
Relative change: -0.59%
High: 112.64
Low: 111.56
Trend: Bullish /Bearish correction
Resistance 1: 112.19-112.40 area, July 11 high and intraday swing low
Resistance 2: 112.64 July 12 high
Resistance 3: 113.18, 2018 high
Resistance 4: 113.26-113.38, 200-weekly simple moving average and January 8 high
Resistance 5: 114.45 October 27, 2017 high
Support 1: 111.60-111.80 area, 23.6% and 38.2% Fibonacci retracement low/high July 11
Support 2: 111.39 May 21 swing high
Support 3: 111.02-111.16 previous intraday swing lows
Support 4: 110.90 June 15 swing high
