- USD/MXN stays below 200-bar SMA within the monthly triangle.
- 38.2% Fibonacci retracement adds strength to the supports.
- April 24 high, March top adds barriers to the upside momentum.
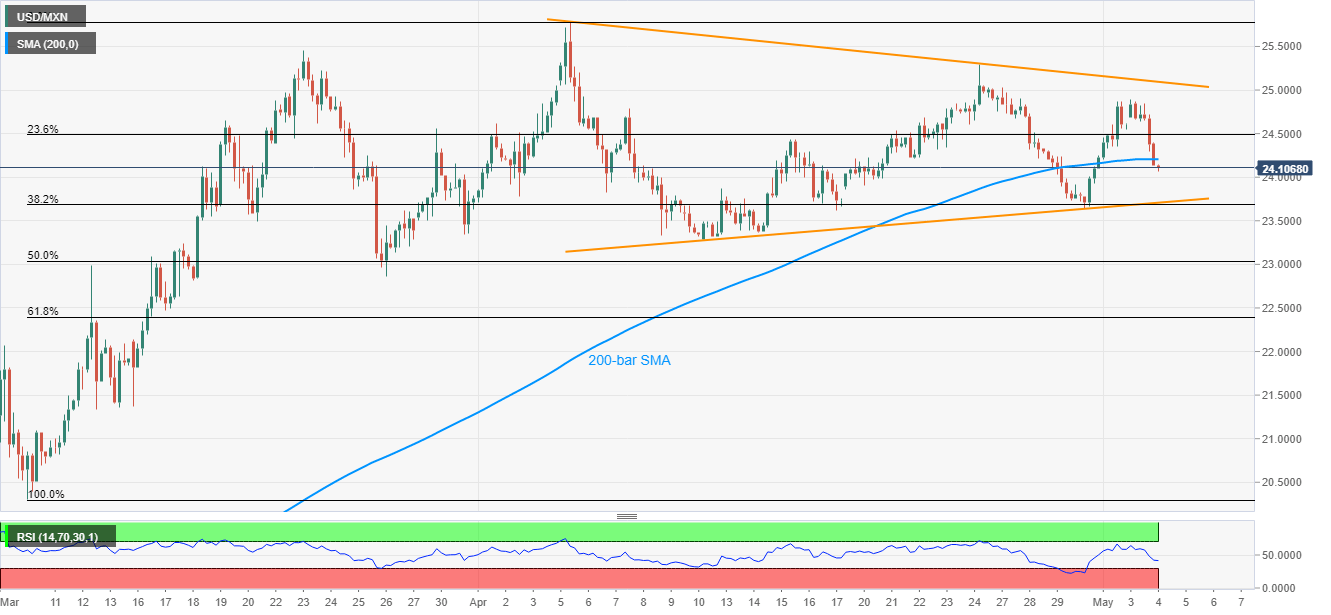
USD/MXN bounces off three-day low to 24.10, up 0.16% on a day, during the early Asian session on Tuesday. Even so, the pair stays below 200-bar SMA within a short-term symmetrical triangle formation.
While the pair’s sustained break below 200-bar SMA drags it towards the pattern’s support of 23.70%, 38.2% Fibonacci retracement of March-April upside also limits the further downside around then.
However, a sustained break of 23.70 enables the bears to target April monthly low near 23.30.
On the contrary, an upside clearance of 200-bar SMA, currently near 24.20, can trigger recovery moves towards 23.6% Fibonacci retracement and Friday’s top, around 24.50 and 24.90 respectively.
Although the triangle’s resistance, at 25.10 now, can keep the pair’s upside past-24.90 limited, April 24 high close to 25.30 and March month high near 25.46 offer additional stops during the run-up to the record high near 25.80.
USD/MXN daily chart
Trend: Further downside expected
