- USD/MXN sees the longest stretch of daily losses in seven months.
- MXN could gain further, as technical studies indicate bears are in control.
USD/MXN fell for the sixth straight day on Monday as oil prices remained bid, helping the Mexican Peso draw bids.
That is Peso’s longest daily winning run in seven months. At press time, the local unit is trading largely unchanged on the day at 22.5538.
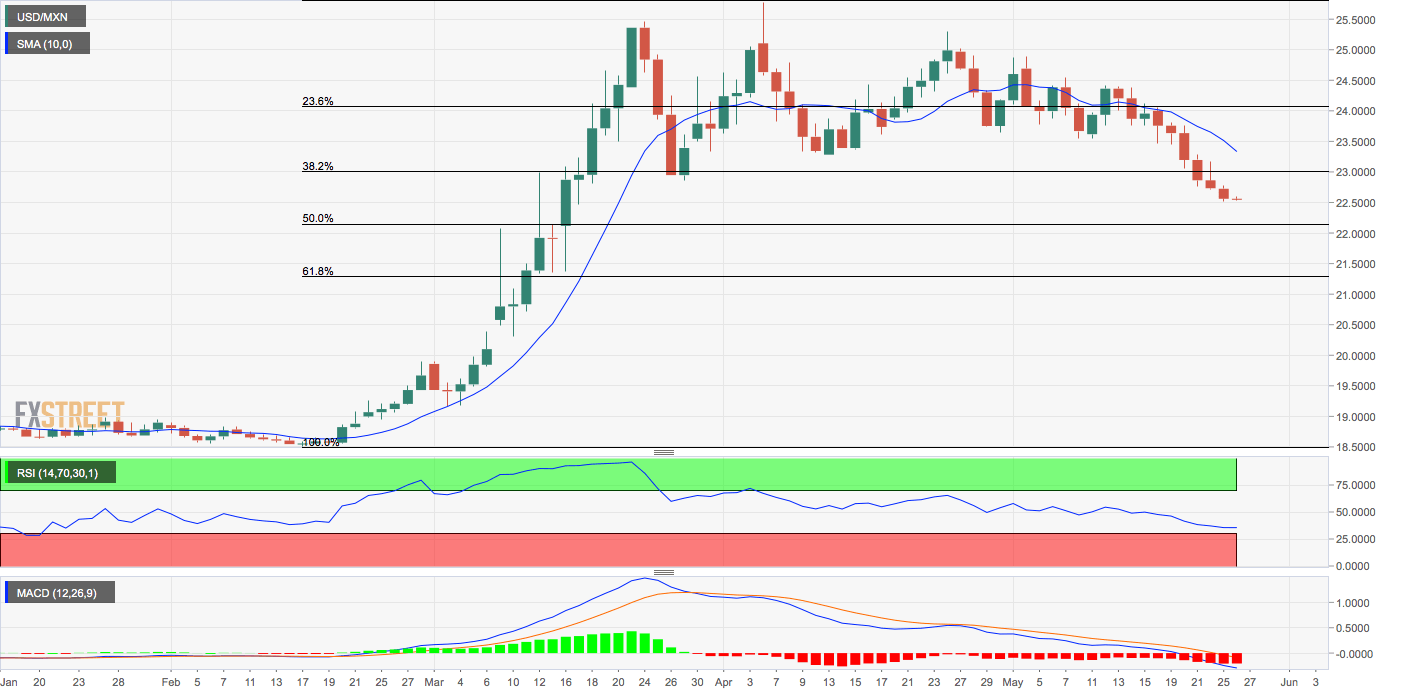
Technical charts indicate the MXN’s rally has legs. The USD/MXN pair has found acceptance under the widely-tracked 38.2% Fibonacci retracement level of the rally from February low to April high and the breakdown is backed by a below-50 reading on the 14-day relative strength index (RSI). The MACD histogram, too, is producing deeper bars below the zero line, indicating a strengthening of the bearish momentum.
A major support is now located at 21.633 (100-day moving average), which, if breached, would expose the 61.8% Fibonacci retracement of 21.2942.
On the higher side, a close above the descending or bearish 10-day average, currently at 23.3285 is needed to abort the immediate bearish trend.
Daily chart
Trend: Bearish
Technical levels
