- USD/MXN fails to cross 21-day SMA, 23.6% Fibonacci retracement.
- A three-week-old rising trend line on sellers’ radar amid bearish MACD.
- The late-March high will validate a fresh upside towards the record high.
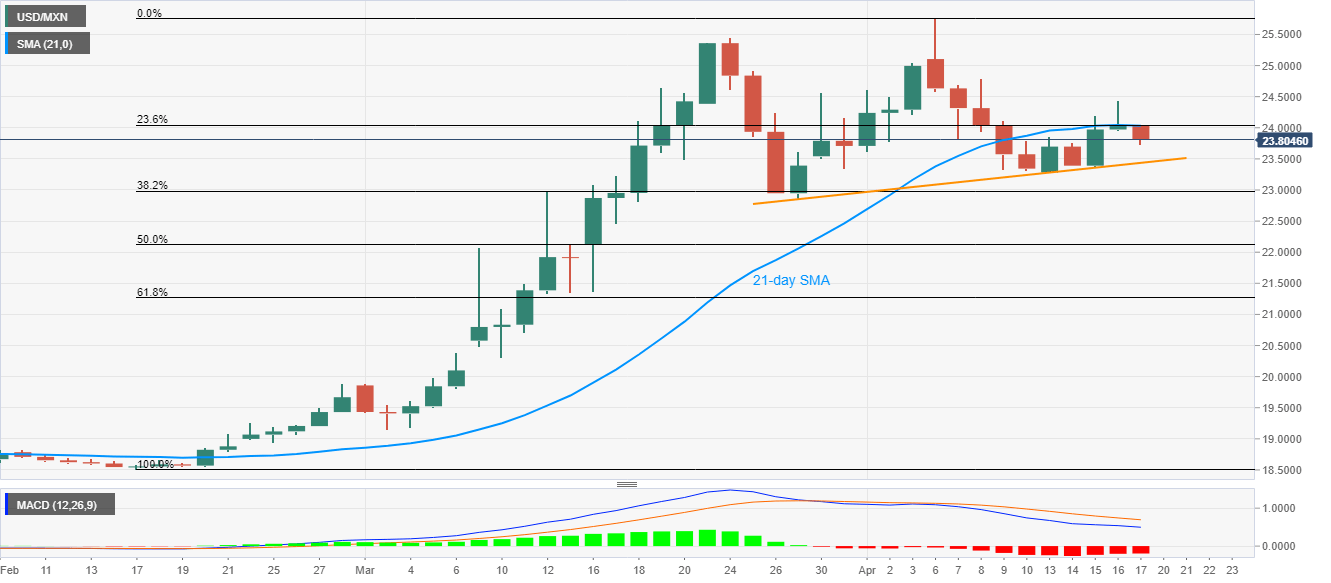
While portraying another U-turn from 21-day SMA and 23.6% Fibonacci retracement of February-April upside, USD/MXN drops to 23.8% during the Asian session on Friday.
Considering the pair’s sustained trading below near-term key resistance confluence and bearish MACD signals, the USD/MXN prices are likely to extend the latest pullback.
The quote presently declines towards a short-term rising trend line, at 23.44 now, a break of which could aim for March 27 low near 22.85.
In a case where the bears sneak in below 22.85, 50% Fibonacci retracement level of 22.12 and 22.00 round-figure will return to the charts.
Meanwhile, 24.45 and 25.00 could entertain buyers ahead of pushing them towards the March month high of 25.46.
Though, a successful run-up beyond 25.46 could push the buyers to question the record high figures of 25.78.
USD/MXN forecast chart
Trend: Pullback expected
