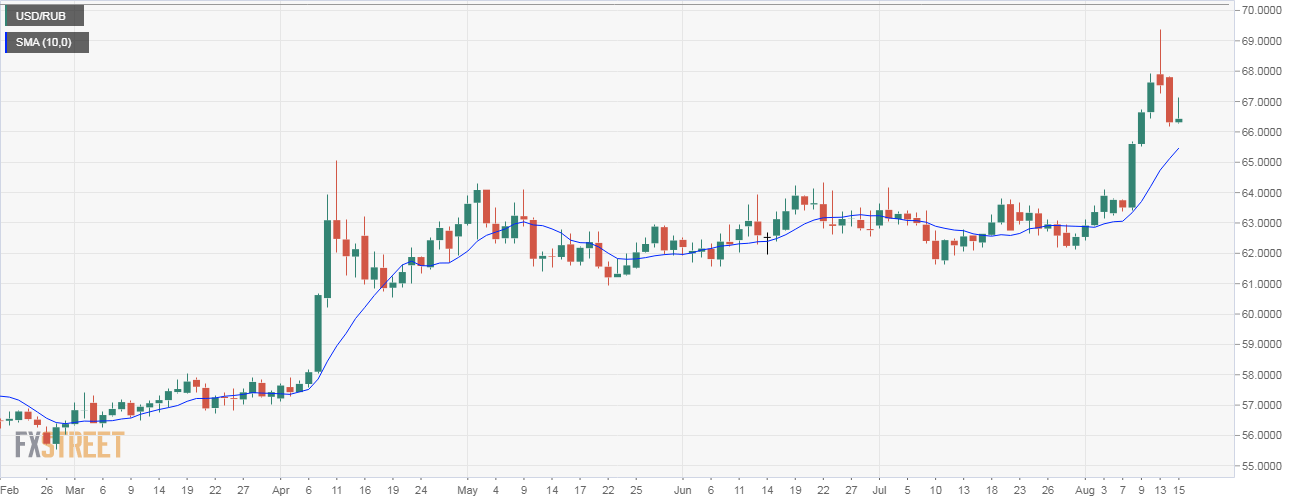
- The USD/RUB pair created a large spinning top on Monday and posted a negative follow-through yesterday, confirming a short-term bullish-to-bearish trend change. As a result, the 10-day moving average (MA) support of 65.92 could be put to test.
- It appears the relief rally in Turkish lira is likely helping the Russian Rouble (RUB) score gains against the greenback.
- However, the downside in USD/RUB could be limited as the relief rally in the TRY could be short-lived, given the TRY put value is holding near record highs.
Daily chart
Spot Rate: 66.52
Daily High: 66.75
Daily Low: 66.52
Trend: Bearish
R1: 67.26 (5-day moving average)
R2: 67.45 (200-hour moving average)
R3: 68.00 (psychological hurdle)
Support
S1: 65.92 (10-day moving average)
S2: 65.53 (previous day’s low)
S3: 64.99 (Apr. 11 high)
