- USD/TRY bounces off 23.6% Fibonacci retracement of November 06-19 fall.
- Normal RSI conditions suggest further recovery, 8.0000 becomes the key upside barrier.
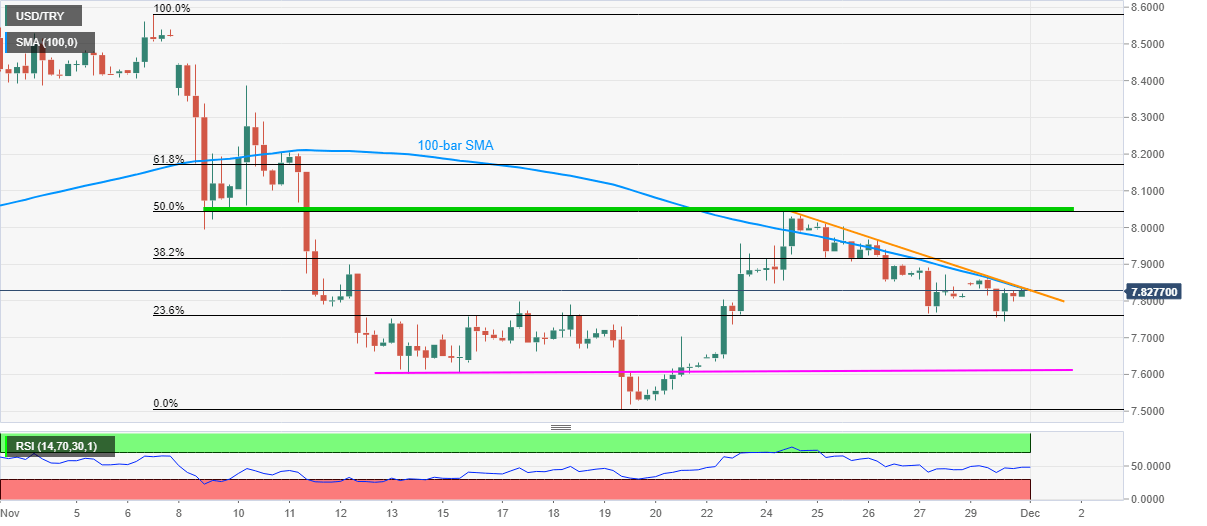
USD/TRY trims losses while rising to 7.8288 during early Tuesday. Even so, the quote remains sideways between 7.8230 and 7.8330 since initial trades in Asia.
While 23.6% Fibonacci retracement level triggered the quote’s latest U-turn from 7.7432, a confluence of 100-bar SMA and a falling trend line from November 24, currently around 7.8350/70 restricts the immediate upside.
Also acting as the strong resistance is last Tuesday’s top near 50% Fibonacci retracement close to the 8.0000 threshold.
Alternatively, a downside break of 7.7432 can eye for the two-week-old horizontal support around 7.6100 ahead of challenging November’s low near 7.5060.
Overall, the bulls are struggling to retake controls but the bears have firmer grips.
USD/TRY four-hour chart
Trend: Further weakness expected
