- USD/TRY replicates the previous day’s sluggish moves inside a bearish chart pattern.
- Downbeat MACD also favors sellers but 21-day SMA adds strength to triangle support.
- Multiple hurdles to the north keep buyers less hopeful of a rally.
USD/TRY seesaws around 8.4560 while extending Wednesday’s sideways grind to early Thursday. In doing so, the Turkish lira (TRY) pair stays around the short-term ascending triangle’s resistance line amid downbeat MACD signals.
Given the pair’s multiple failures to cross the 8.4900 hurdle, USD/TRY is likely to witness another pullback. However, a confluence of 21-day SMA and support line of the stated triangle, near 8.3580 becomes the key.
Should the sellers manage to conquer the 8.3580 strong support, the pair’s slump towards the mid-April low near 8.0100 becomes imminent.
Meanwhile, an upside clearance of 8.4900 resistance will have to cross the 8.5000 round-figure, as well as the all-time peak close to 8.5800, to favor the USD/TRY bulls.
Overall, USD/TRY bulls seem tired of late, which in turn backs the hopes of a pullback move inside a bearish chart formation.
USD/TRY daily chart
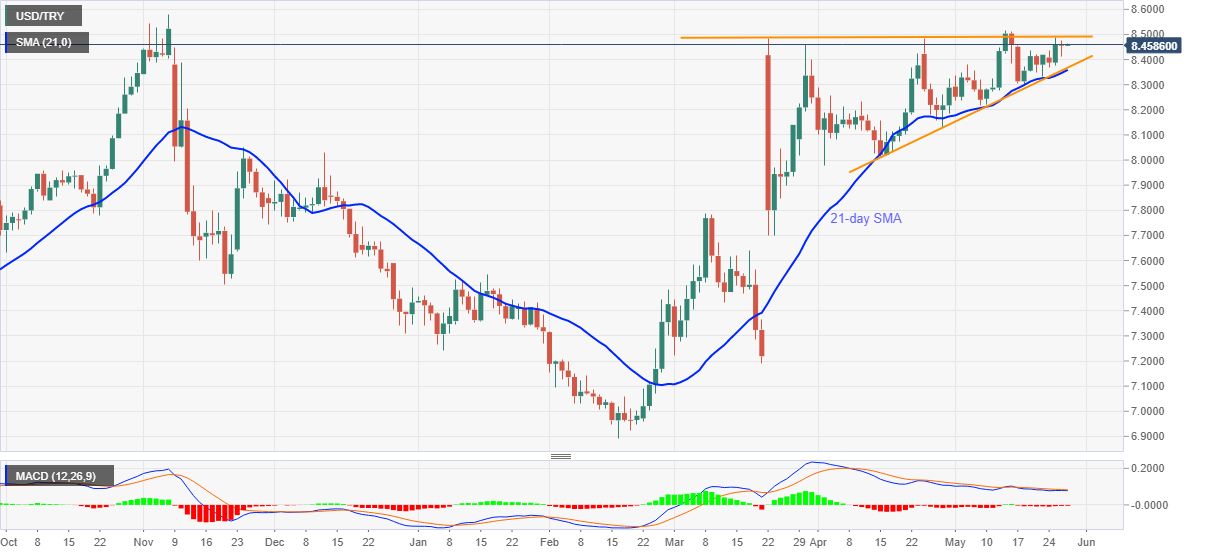
Trend: Pullback expected
