- USD/TRY extends bounce from 21-DMA into the second day.
- Technical indicators on the daily chart suggest more gains.
- A test of record highs above $8.51 back on the cards?
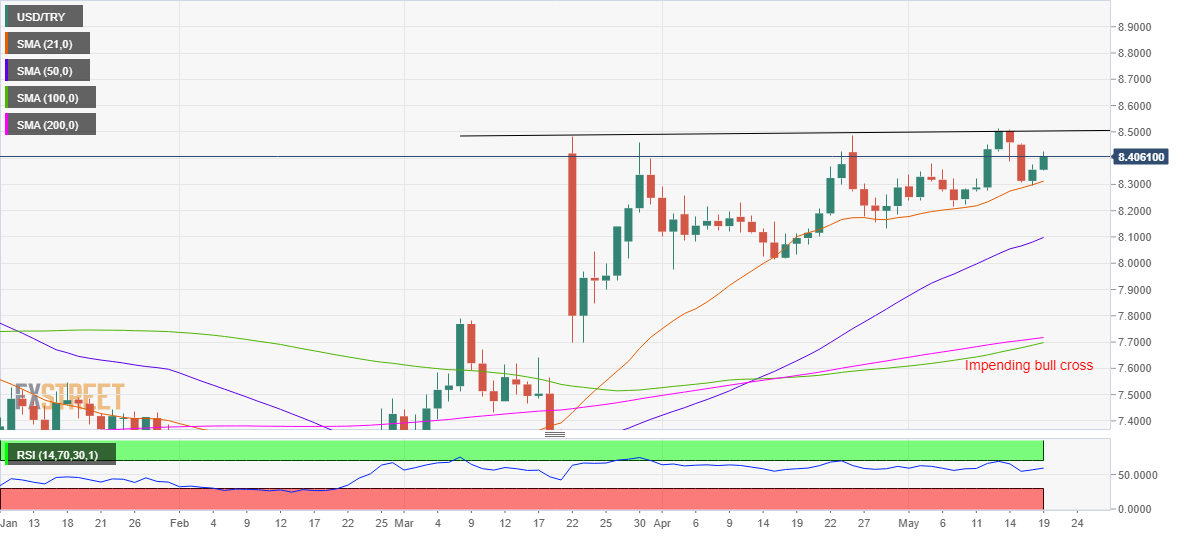
USD/TRY is looking to extend its rebound from four-day lows into the second straight day on Wednesday, having found solid support at the 21-daily moving average (DMA), now at $8.3124.
The bulls now target the Monday high of $8.4550 if the upbeat momentum picks up pace.
Further up, the record highs at $8.5146 could be on the buyers’ radars.
The 14-day Relative Strength Index (RSI) points north while above the midline, suggesting that there is more room to the upside.
A potential bull cross on the said time frame, with the 100-DMA on the verge of cutting above the 200-DMA, also adds credence to another leg higher.
However, if the price gives a daily closing below the crucial 21-DMA support, then a sell-off towards the upward-sloping 50-DMA at $8.0983 cannot be ruled out.
USD/TRY: Daily chart