- USD/TRY down but not out, as a test of all-time highs inevitable.
- The spot wavers within a potential ascending triangle since March 22.
- 21-DMA is the last line of defense for the TRY sellers.
USD/TRY has returned to the red on Wednesday, having faced rejection just below the 8.50 psychological level a day before.
Despite the retracement, the cross remains on track to retest the record highs of 8.5146, as the daily technical setup paints a constructive picture.
Note that the price continues to trade within an ascending triangle formation since the Turkish central bank shake-up, which smashed the lira to the previous record high at 8.4836 on March 22.
The trading range is getting tighter each passing day, as USD/TRY remains primed for a triangle breakout.
The risks remain skewed towards an upside break, given that the 14-day Relative Strength Index (RSI) continues to hold inside the bullish territory.
Adding credence to the positive outlook, a bull cross was spotted on Tuesday after the 100-daily moving average (DMA) sustained its break above the 200-DMA on a daily closing basis.
The ascending triangle breakout could call for the next upswing towards the 9.50 level. Ahead of that the 9.00 round number could be challenged.
USD/TRY: Daily chart
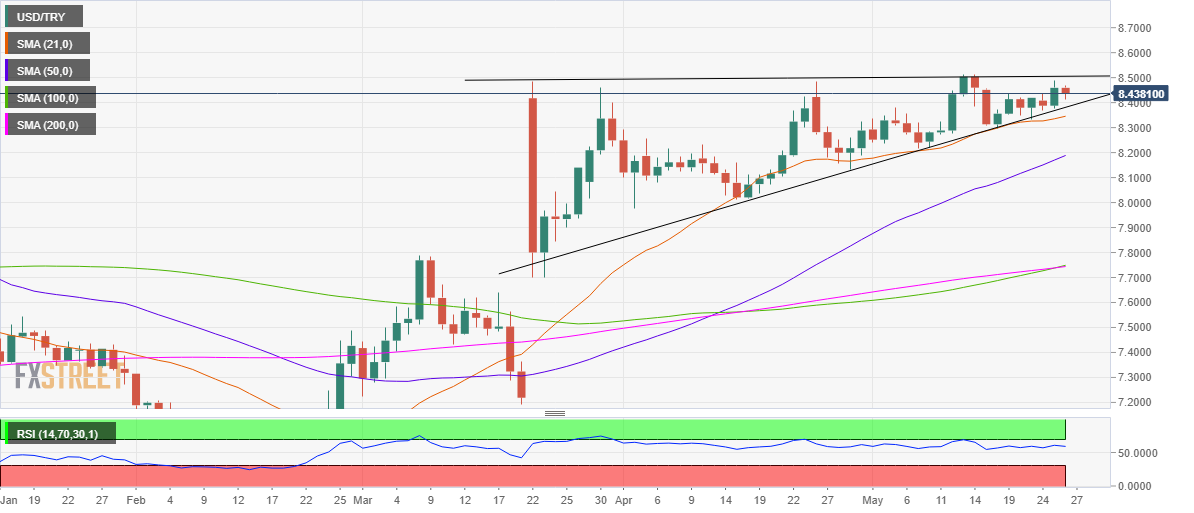
Alternatively, the bulls need to defend critical support around 8.35, which is the confluence of the rising trendline and upwards-loping 21-DMA.
A sharp sell-off towards the 50-DMA at 8.18 could be in the offing should the above-mentioned support cave in.
