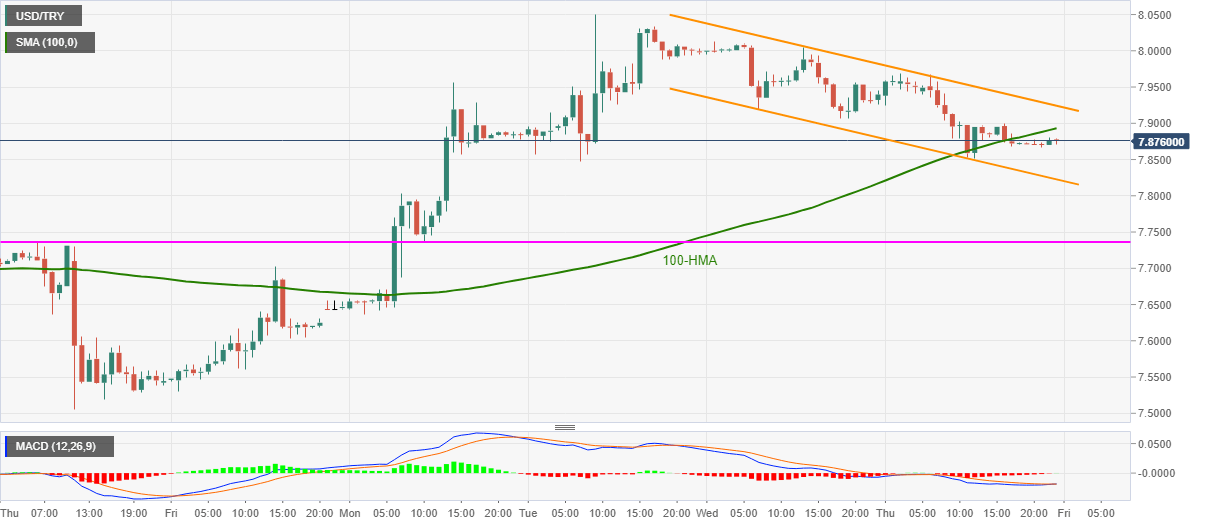
- USD/TRY seesaws in a choppy range below 100-HMA.
- MACD teases recovery moves inside a bearish chart pattern.
- One-week-old horizontal support pops-up on the bears’ radar.
USD/TRY recently eased from the intraday high of 7.886 to 7.8750 amid early Friday’s Asian session. Even so, the quote keeps the previous day’s bounce off 7.8517 to regain the 100-HMA.
Even if the pair manages to cross 100-HMA immediate resistance, at 7.8930 now, based on the MACD signals, a two-day-long descending channel formation keeps the USD/TRY buyers away until witnessing a break of 7.9245/50.
Also likely to challenge the upside momentum is the weekly high near 8.0510 and November 11 top close to 8.2000.
During the USD/TRY downside, the stated channel’s support near 7.8220 and a horizontal line including November 19 high and November 23 low, around 7.7360, will be the key to watch.
If at all the USD/TRY sellers manage to keep the reins past-7.7360, the monthly low of 7.5059 will be on their radars.
USD/TRY hourly chart
Trend: Further weakness expected
