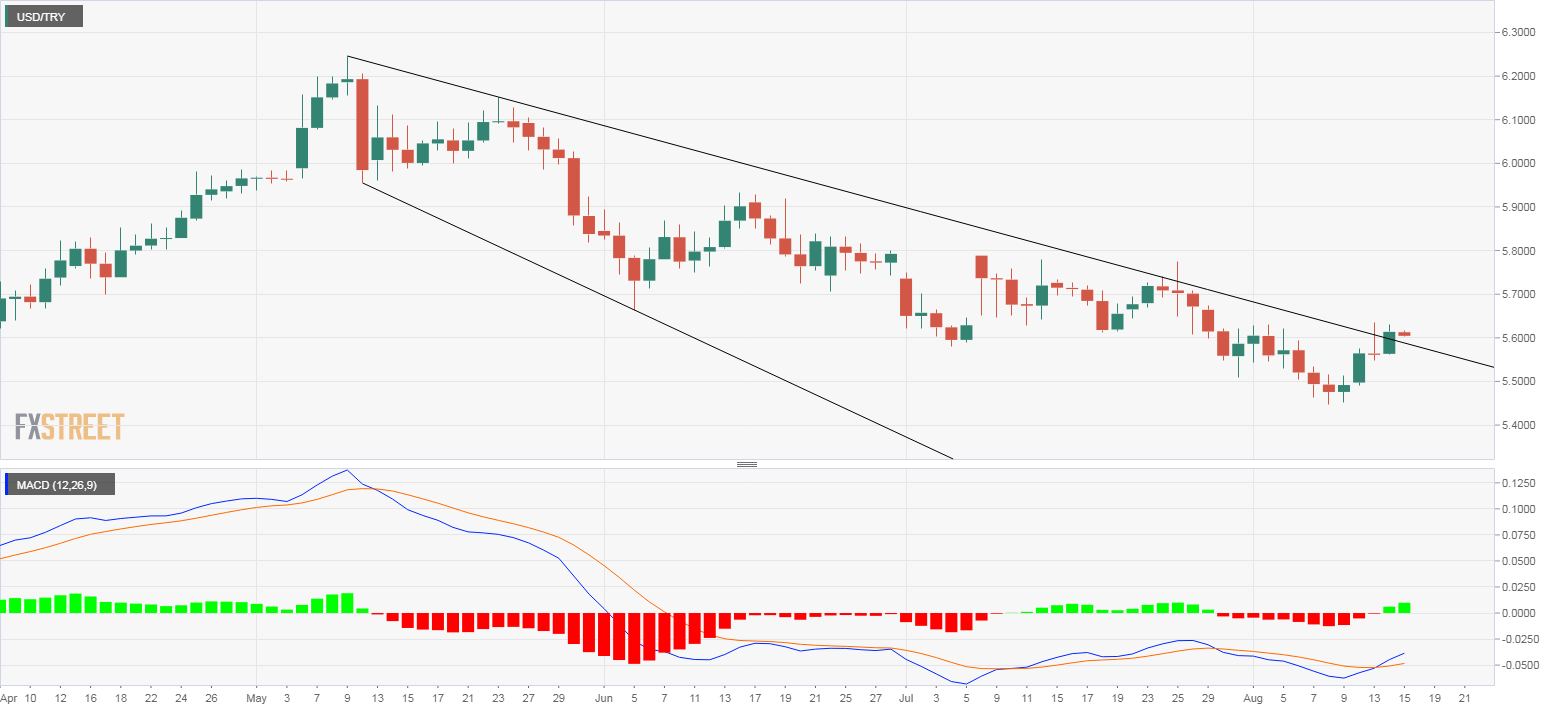
- USD/TRY’s daily chart shows a bearish channel breakout.
- The pair could rise to the immediate resistance at 5.7727 in the next few days.
USD/TRY closed at 5.6107 on Wednesday, confirming an upside break of the three-month-long falling channel.
The bearish channel breakout indicates the sell-off from May’s high of 6.2458 ended at 5.4495 on Aug. 8 and the bulls have regained control.
The moving average convergence divergence histogram crossed above zero, supporting the falling channel breakout.
So, the resistance at 5.7727 (July 25 high) could be put to test in the short-run. As of writing, the pair is trading largely unchanged on the day at 5.6027.
Daily chart
Trend: Bullish
Technical levels
R1: 5.7727
R2: 5.9326
S1: 5.5620
S2: 5.4495
