- Short-term symmetrical triangle confines immediate moves.
- Other than pattern lower-line, 50% Fibonacci retracement is likely important support.
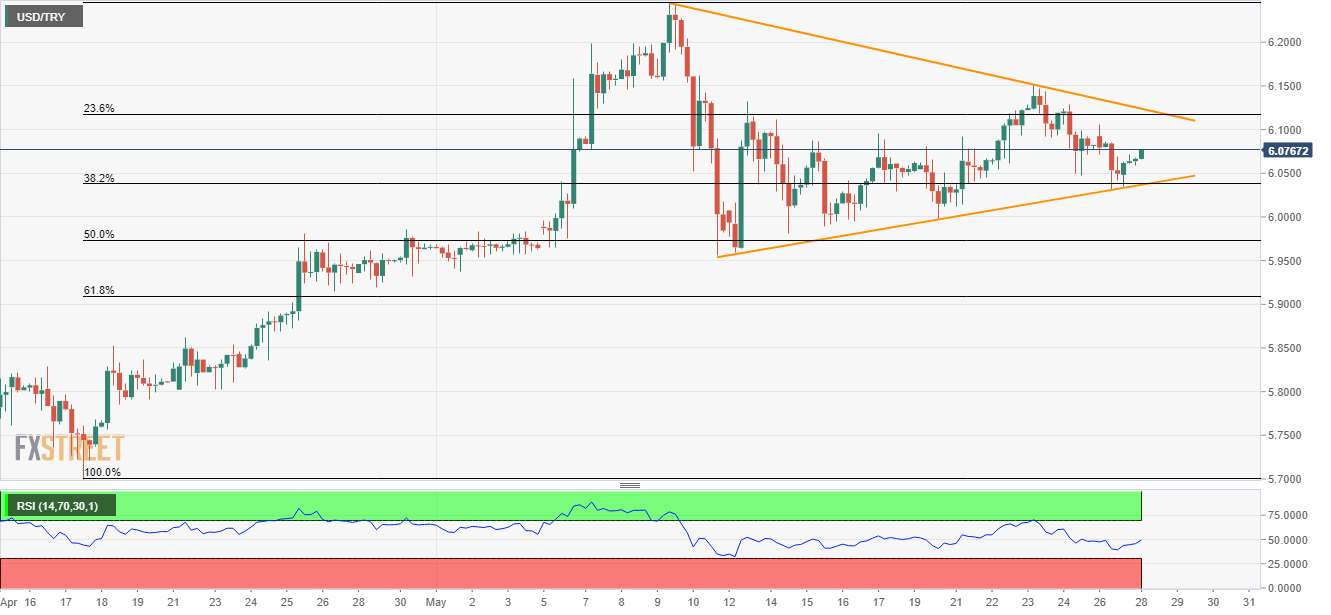
With nearly three-week-old symmetrical triangle formation in place, the USD/TRY pair is presently on the bids near 6.08 during early Tuesday.
Latest bounce from the pattern support signal brighter chances of an up-move towards formation resistance near 6.12.
However, sustained break of 6.12 could open the doors for the pair’s rally in the direction to last week’s high near 6.15 and then to current month tops surrounding 6.25 level.
Alternatively, pattern’s lower-line and 38.2% Fibonacci retracement of April – May rise around 6.04 seem near-term important support, a break of which can highlight the importance of 50% Fibonacci retracement level of 5.97.
If at all prices keep declining under 5.97, 5.95 and 61.8% Fibonacci retracement near 5.91 could come back as quotes.
USD/TRY 4-Hour chart
Trend: Pullback expected
