- USD/ZAR takes the bids near the highest in over a week.
- Bullish MACD, strong U-turn from three-month low favor buyers.
- Sellers may await fresh monthly low before entering any positions.
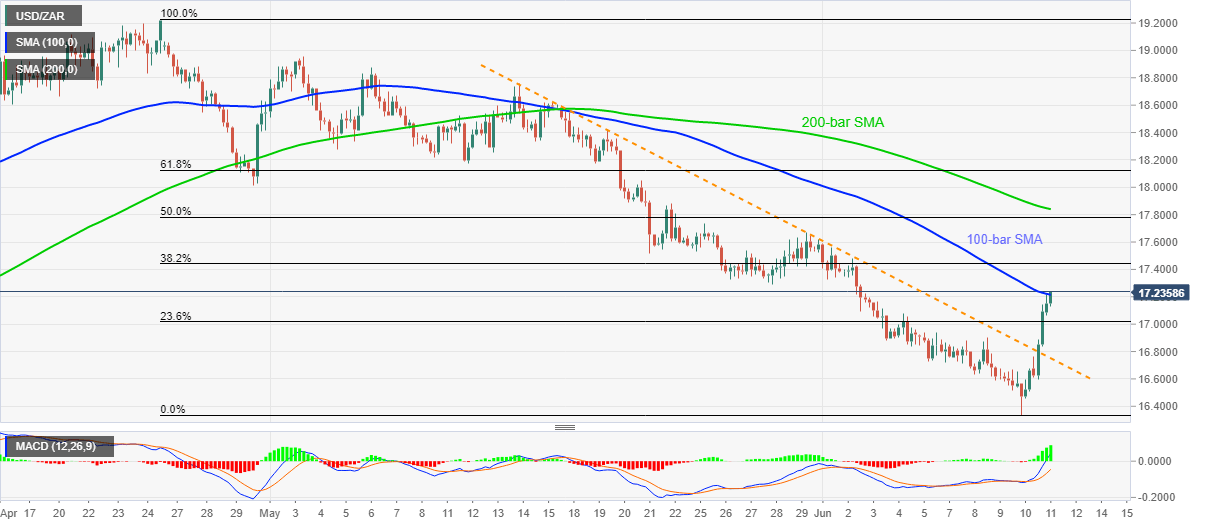
USD/ZAR remains on the bids around 17.23 during the early Friday morning in Asia. The quote did bounce from mid-March lows the previous day while also visiting the highest levels since June 02.
Even so, 100-bar SMA around 17.25 seems to restrict the pair’s immediate upside amid bullish MACD. Also adding to the upside barrier could be May 28 low close to 17.30.
In a case where the USD/ZAR prices can rise past-17.30, May 29 top surrounding 17.67 and 200-bar SMA level of 17.84 could lure the optimists.
Alternatively, the pair’s downside below the resistance-turned-support, currently around 16.75, will have to refresh the monthly low of 16.34 before recalling the bears.
In doing so, 16.00 round-figure and the early-March high adjacent to 15.85 should be given proper justice as supports.
USD/ZAR four-hour chart
Trend: Further recovery expected
