- USD/ZAR eases from the weekly high of 17.49.
- June 15 top may offer immediate support ahead of 100-day EMA.
- May 29 top, 50% Fibonacci retracement could lure the bulls beyond 17.51.
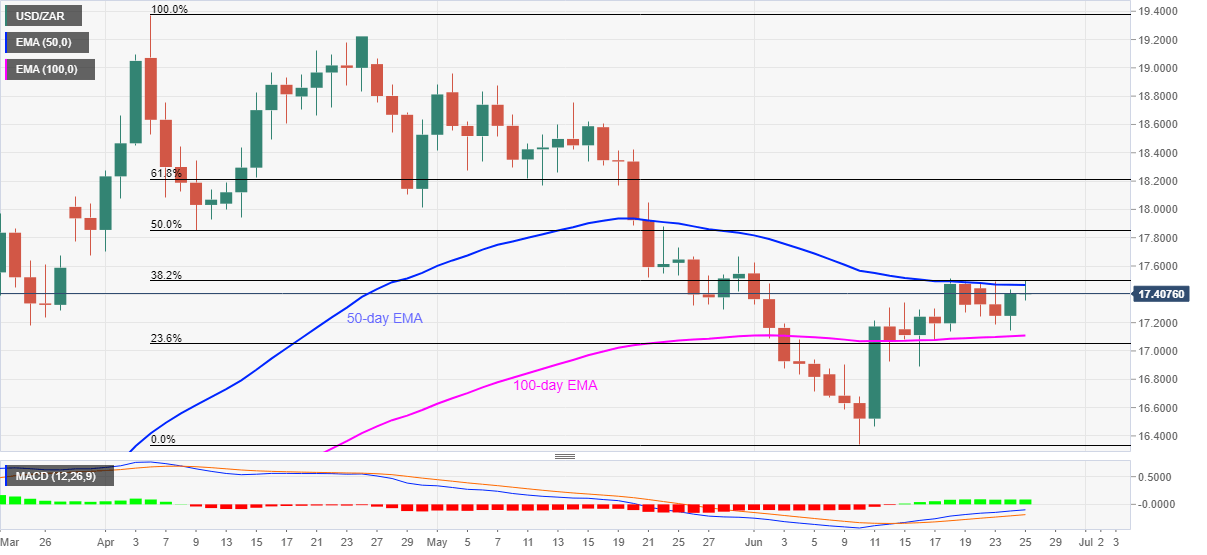
USD/ZAR marks another U-turn from key resistance around 17.50 as it declines to 17.41 during the early Asian session on Thursday. In doing so, the quote slips from one-week high. The pair’s repeated failures to cross 38.2% Fibonacci retracement of its April-June downside joins the inability to provide a daily close beyond 50-day EMA to keep the bears hopeful.
As a result, the USD/ZAR prices are currently declining towards June 15 high surrounding 17.35. Though, a 100-day EMA level of 17.11 might restrict the pair’s further weakness.
If at all, the quote closes below the key EMA, 16.90 and 16.67 may lure the sellers before diverting them to the monthly low of 16.52.
Meanwhile, an upside clearance of 17.51 can quickly propel the pair towards May 29 peak near 17.67 and then to 50% Fibonacci retracement level, at 17.85.
During the quote’s further rise past-17.85, April 13 low near 18.00 will be the bulls’ favorite.
USD/ZAR daily chart
Trend: Pullback expected
