- USD/ZAR keeps Friday’s recovery moves from 17.09 to stay above the key EMA.
- A two-month-old falling trend line restricts further recovery.
- 61.8% Fibonacci retracement, the monthly low can lure the bears.
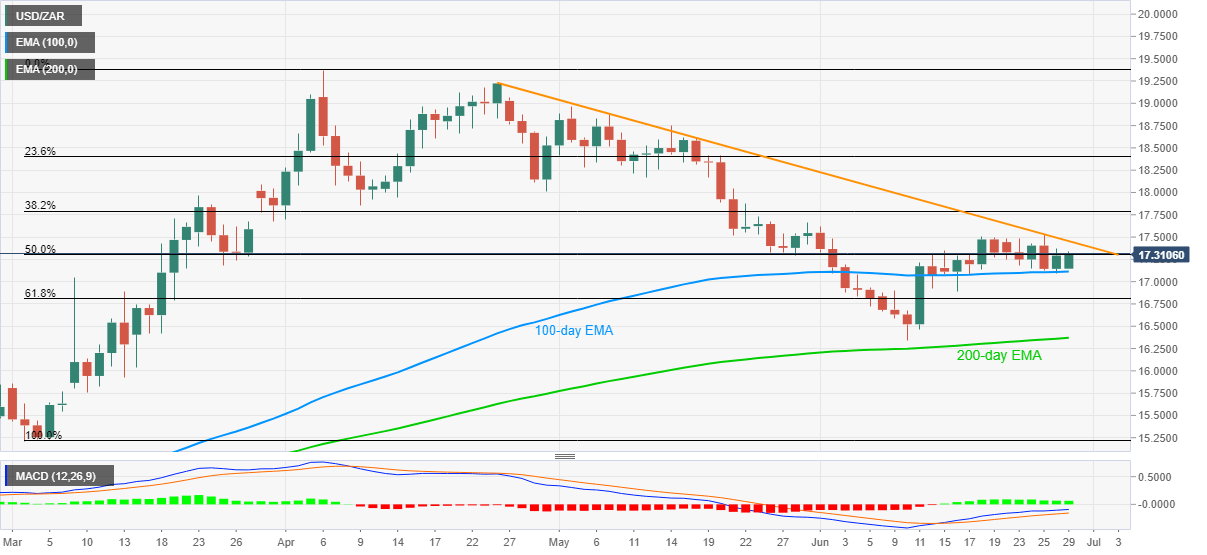
USD/ZAR takes the bids near 17.33 during the initial hour of Tokyo open on Monday. The pair remains above 100-day EMA since the early days of the month amid bullish MACD signals. Even so, a falling trend line from April 24 seems to challenge the bulls at present.
In a case where the bulls cheer MACD signals and cross the 17.45 resistance line on a daily closing, May 29 high surrounding 17.66 and April 30 low near 18.00 could be on their radars. However, multiple resistances between 18.00 and 18.20 could challenge the pair’s further upside.
If at all the bulls dominate past-18.20, 19.00, 19.22 and April month’s top near 19.38 might offer intermediate halts during the rise to 20.00 threshold.
Alternatively, the pair’s declines below 100-day EMA level of 17.11 could drag it to 61.8% Fibonacci retracement of March-April upside near 16.80.
Though, a 200-day EMA level of 16.37 and the monthly low near 16.33 could question the pair bears below 16.80.
USD/ZAR daily chart
Trend: Bullish
