- USD/ZAR stays pressured near two-month low of 17.52.
- April-end low, the monthly resistance line add to the upside barriers.
- A confluence of 100-day EMA, rising trend line from late-January keeps buyers hopeful.
USD/ZAR drops to 17.59, down 0.27% on a day, amid Tuesday’s Asian session. Having slipped below April 30 low during the previous day, the pair currently stays under 50-day EMA for the fourth consecutive day, which in turn portrays its weakness.
As a result, sellers may aim for 38.2% Fibonacci retracement of January-April upside, at 17.28 while a joint of 100-day EMA and a four-month-old ascending support line, at 17.08 now, can challenge the bears then after.
It’s worth mentioning that a daily closing beyond 50-day EMA, currently around 17.88, will need to cross late-April low of 18.02 ahead of confronting the monthly resistance line nearing 18.48.
In a case where the bulls manage to cross 18.48 level on daily closing, they can challenge 19.00 round-figure while crossing the monthly high of 18.96.
USD/ZAR daily chart
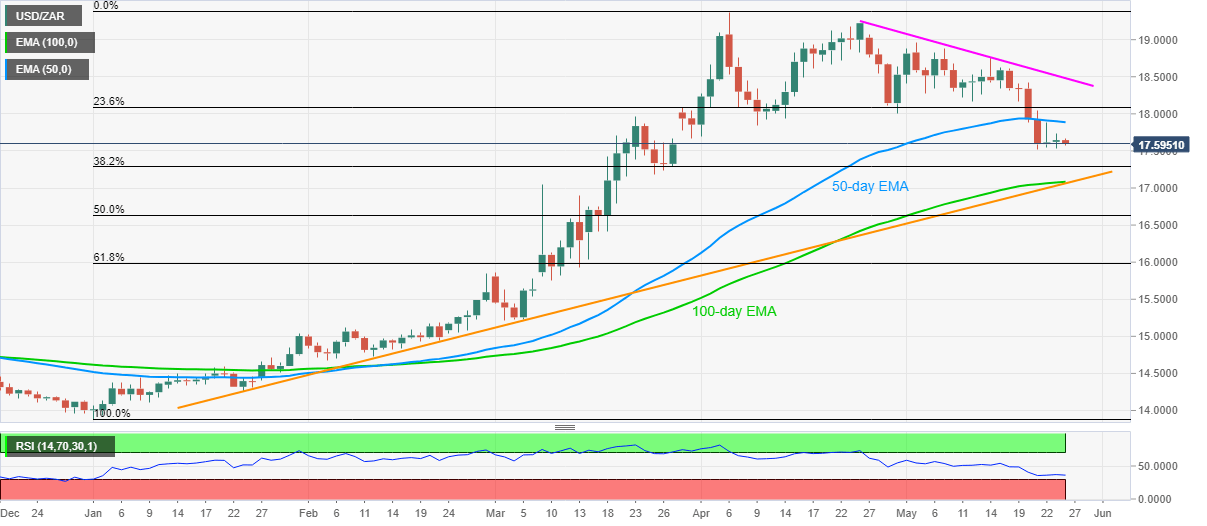
Trend: Further declines expected
