- USD/ZAR struggles to keep the bounce off 16.99.
- Sustained weakness below the key EMA pushes the bears towards one-month-old horizontal support.
- Buyers will have 50-day EMA as an additional upside barrier to justify their strength.
USD/ZAR takes rounds to 17.05 during the early Thursday morning in Asia. The pair recently broke a two-week-old trading range while slipping below 100-day EMA, which in turn dragged it to the lowest levels since June 16. However, bullish MACD signals and 17.00 round-figure seem to offer pullback moves to the quote off-late.
As a result, the sellers will wait for a clear break below 17.00 while keeping eye on the 16.90/85 horizontal support, comprising multiple highs and lows marked from June 03.
If at all the bears dominate below 16.85, 16.67 and 200-day EMA level of 16.39 will be the strong supports to watch before June month’s bottom of 16.33.
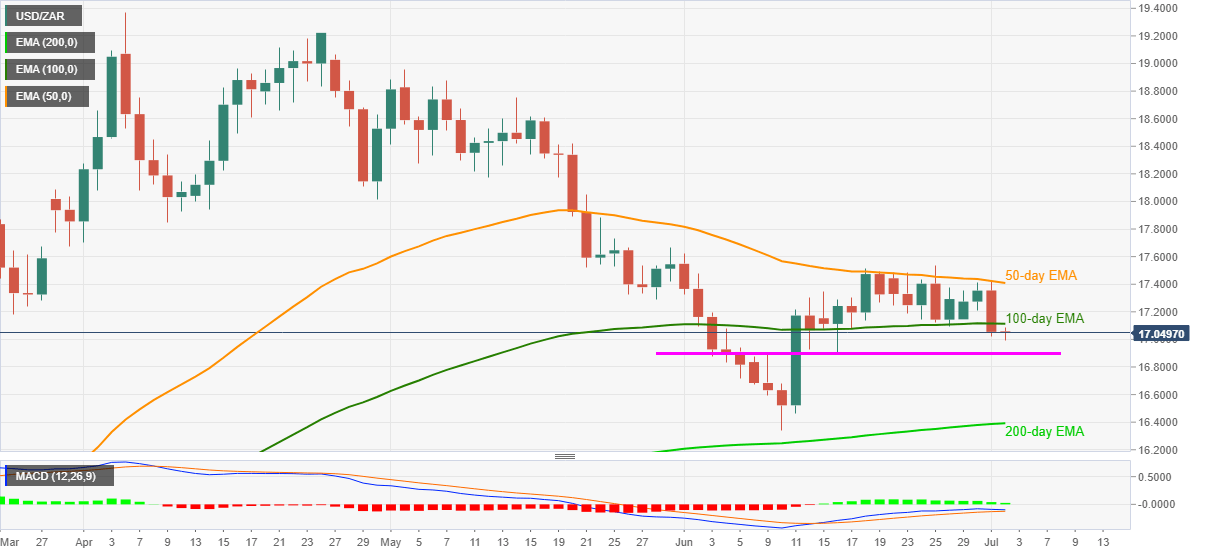
On the contrary, buyers will re-enter once the pair successfully crosses a 100-day EMA level of 17.11. Though, 50-day EMA near 17.40 could keep challenging further upside moves. It’s worth mentioning that the previous monthly top close to 17.55 also offers the key resistance past-17.40
USD/ZAR daily chart
Trend: Bearish
