- USD/ZAR extends the previous day’s losses to test the lowest since June 11.
- 50% Fibonacci retracement questions immediate downside ahead of the key EMA.
- A three-week-old falling trend line guards nearby rise.
USD/ZAR drops to 16.66 during Wednesday’s Asian session. In doing so, the pair revisits the lowest levels in five weeks amid bearish MACD. However, 50% Fibonacci retracement level of its January-April upside restricts the immediate declines.
Other than the crucial Fibonacci retracement level near 16.60, a 200-day EMA level of 16.43 also questions the pair bears ahead of the June month’s low near 16.30.
Given the quote’s sustained downside past-16.30, 16.00 threshold and 61.8% Fibonacci retracement level near 15.97 will be important supports to watch.
Meanwhile, the weekly top near 16.89 and 17.00 round-figures might entertain short-term buyers. Though, a descending trend line from June 25, at 17.15 now, will guard the further pair’s upside.
USD/ZAR daily chart
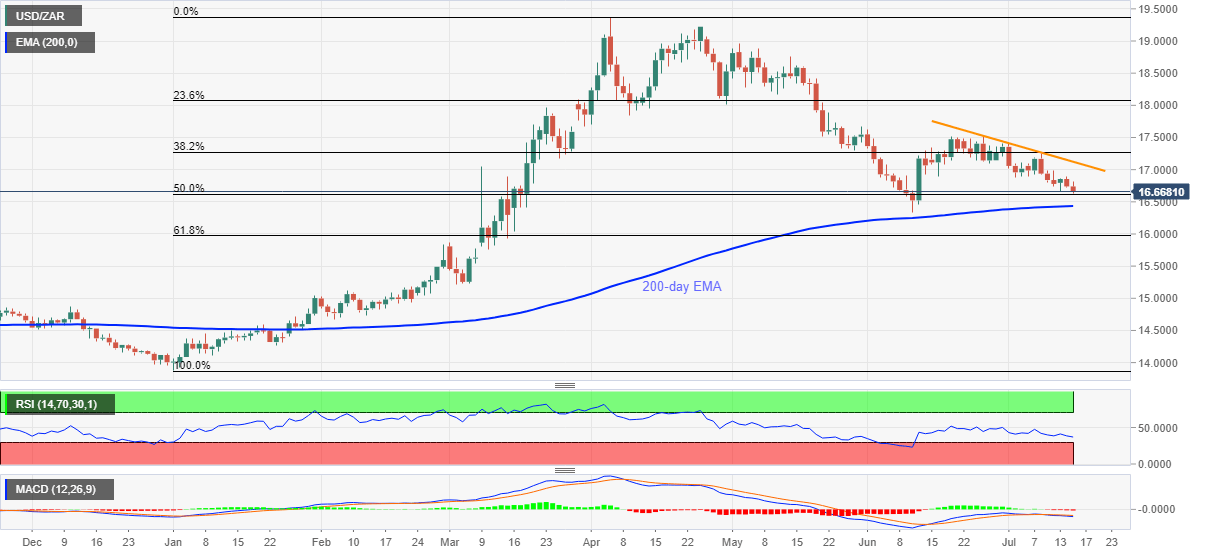
Trend: Bearish
