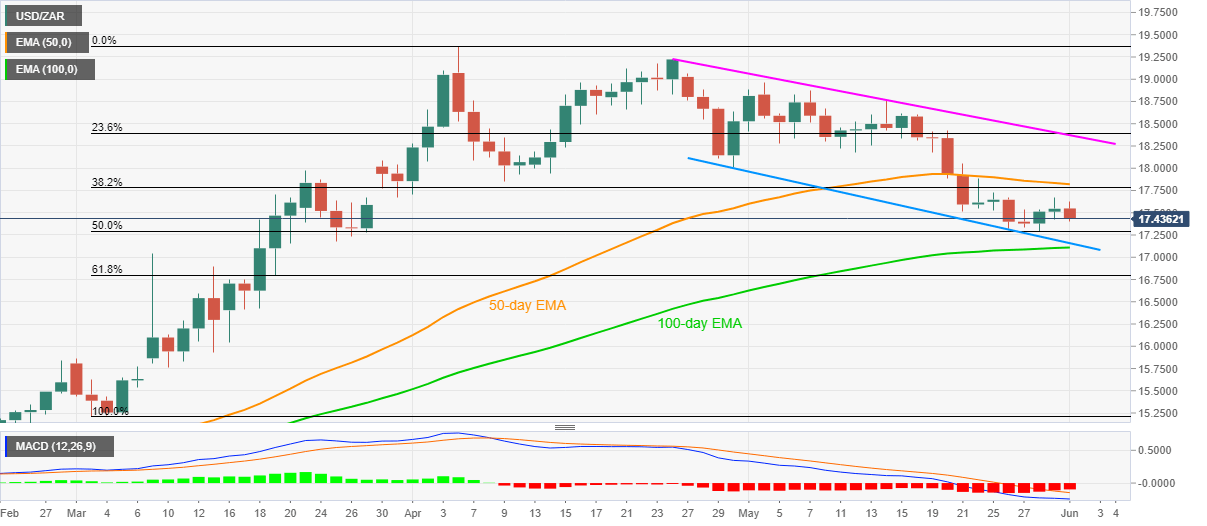
- USD/ZAR again reverses from 17.67, needs to mention about 50-day EMA, 38.2% Fibonacci retracement.
- A month-old support line, 100-day EMA lure the bears.
- Bearish MACD keeps the buyers away unless breaking a five-week-old resistance line.
While extending its pullback from 17.67, USD/ZAR declines to 17.44, down 0.62% on a day, during the pre-European session on Monday.
The pair’s recent weakness joins the bearish MACD signals to aim for 50% Fibonacci retracement of March-April upside, around 17.30.
However, a confluence of 100-day EMA and a falling trend line from April 30, around 17.15/10, could challenge the sellers afterward.
On the upside, the pair’s break above 17.67 pushes it towards 38.2% Fibonacci retracement and 50-day EMA, near 17.78/82.
If at all the bulls manage to cross 17.82 on a daily closing basis, a confluence of 23.6% Fibonacci retracement and a falling trend line from April 24, surrounding 18.40/35, will be in the spotlight.
USD/ZAR daily chart
Trend: Sideways
