- USD/ZAR steps back from the three-day top of 17.61.
- U-turn from channel’s support, amid oversold RSI, keeps the buyers hopeful.
- The yearly ascending trend line provides strong support below the channel formation.
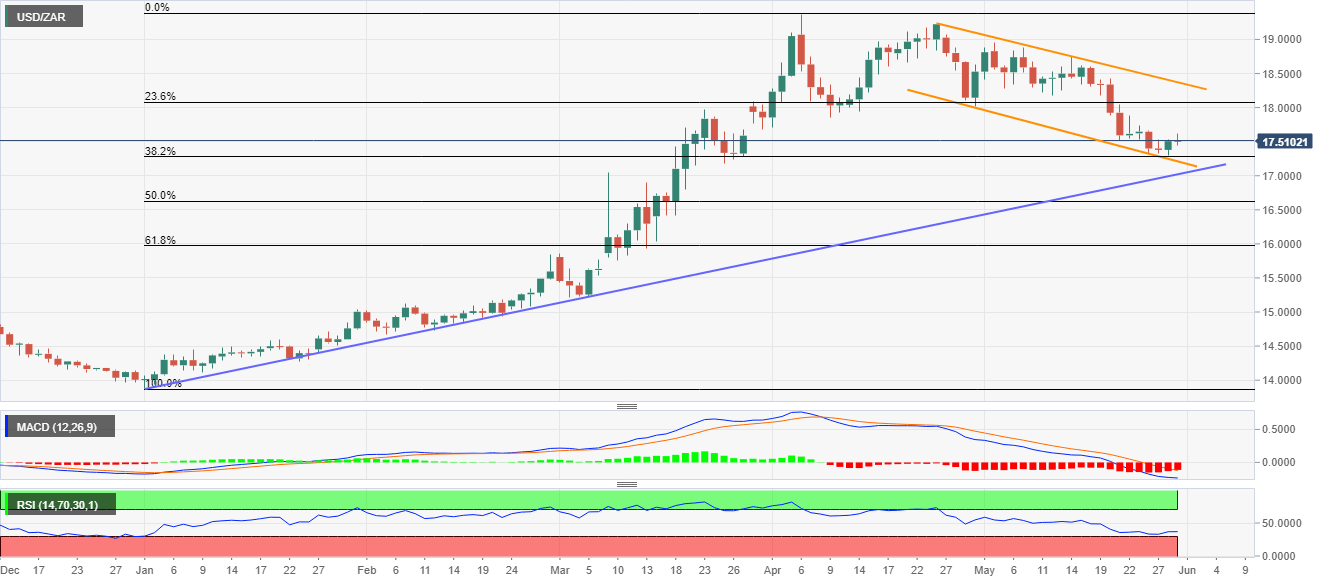
USD/ZAR drops to 17.50 amid the initial Asian session on Friday. The pair bounced off the support line of a falling trend channel from April 24 while taking support from the oversold RSI conditions on Thursday. Though, buyers fail to ignore bearish MACD and struggle to keep the reins above 17.00.
As a result, sellers are on the lookout for entries and wait for the clear signals. In doing so, the channel’s lower line, at 17.20, will be backed by an ascending trend line from January 01, 2020, currently around 17.00.
If at all USD/ZAR prices slip below 17.00 on a daily closing basis, 61.8% Fibonacci retracement of January-April upside, close to 16.00, will lure the sellers.
Alternatively, the bulls may stay cautious unless the quote crosses the upper line of the said channel, at 18.40 now. However, an intermediate pullback to 17.90 can’t be ruled out.
USD/ZAR daily chart
Trend: Bearish
