Hello traders, today’s article is going to be about USDCAD, its daily and 4h view. Let’s jump in.
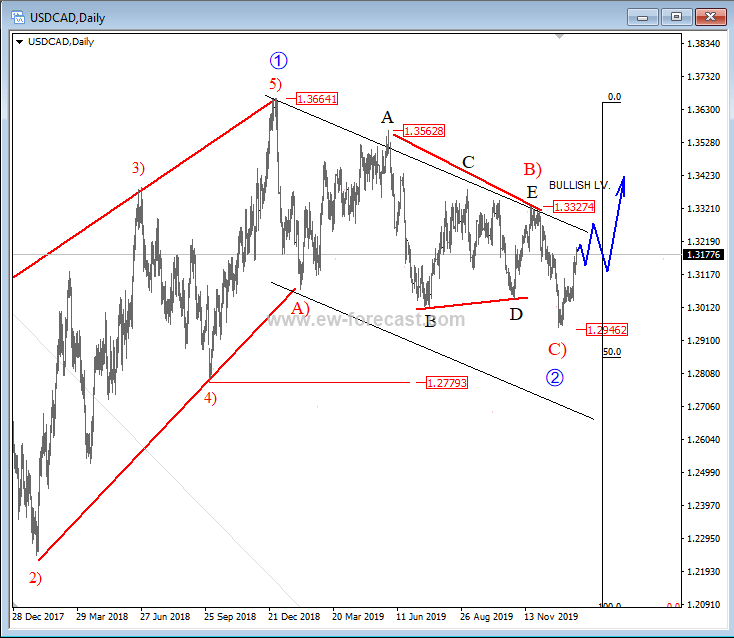
On the daily chart of USDCAD we can see that price made a big converging price action within a wave 1 up from 2017; an Elliott wave leading diagonal which found a top at the 1.366 level and started reversing into a corrective retracement. We labeled a fully completed wave 2 corrections, which unfolded a zig-zag: an impulse in legs A) and C), and a triangle in a wave B). A low for the correction was later seen at the 1.294 level, from where a new rise started developing.
USDCAD, Daily
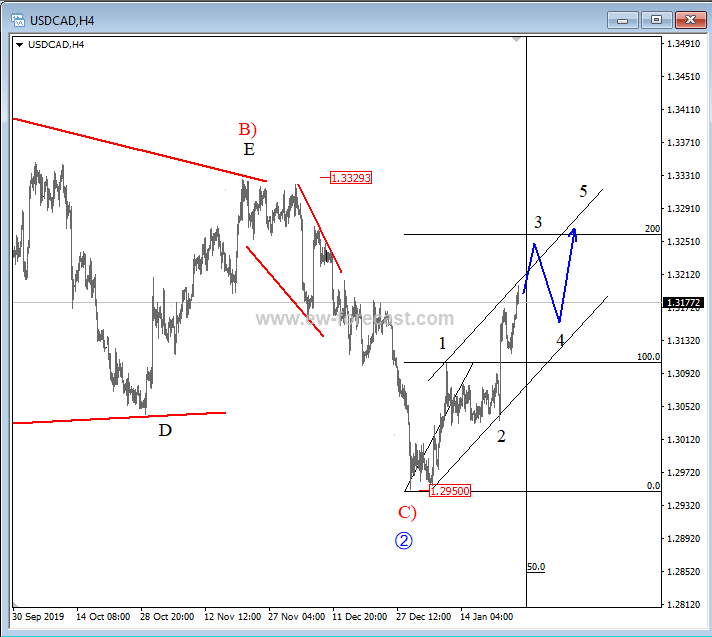
Now on the 4h chart, we have a closer look of a completed impulse in C) of 2, and a strong recovery which can be a new five-wave move higher in progress. We are currently observing a wave 3 in action, which can face resistance/bearish turn into a temporary pullback (4) as part of an impulse near the Fib. the ratio of 200 and near the upper Elliott wave channel line (1.321/1.326 region).
USDCAD, 4h