Home USDJPY Completing A Pullback and Turning Higher – Elliott wave
Daily Look

USDJPY Completing A Pullback and Turning Higher – Elliott wave

Hello traders,

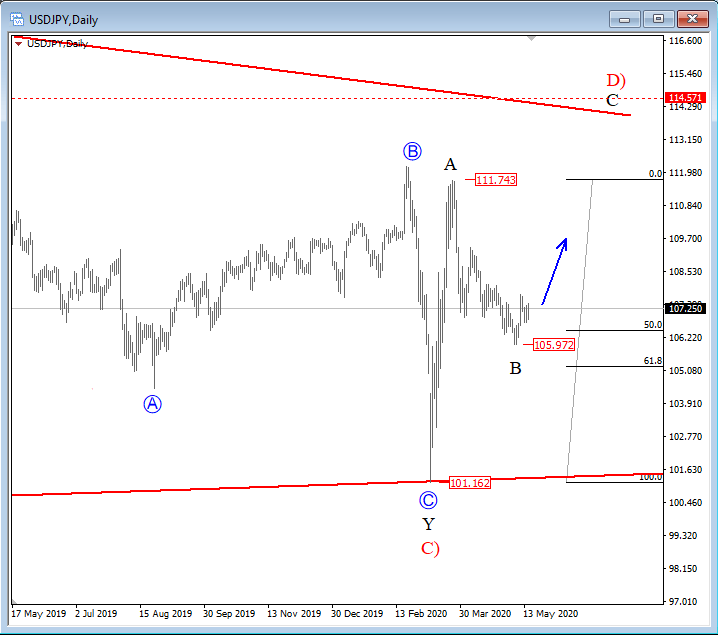
USDJPY made a sharp rise from the 101.16 level, following a completed A-B-C move into a leg Y of C), which is part of a bigger triangle correction. We labeled recent rally as A of D), which is completed at 111.74 level, and is being retraced for almost 61.8 percent into a corrective wave B.  

USDJPY, daily

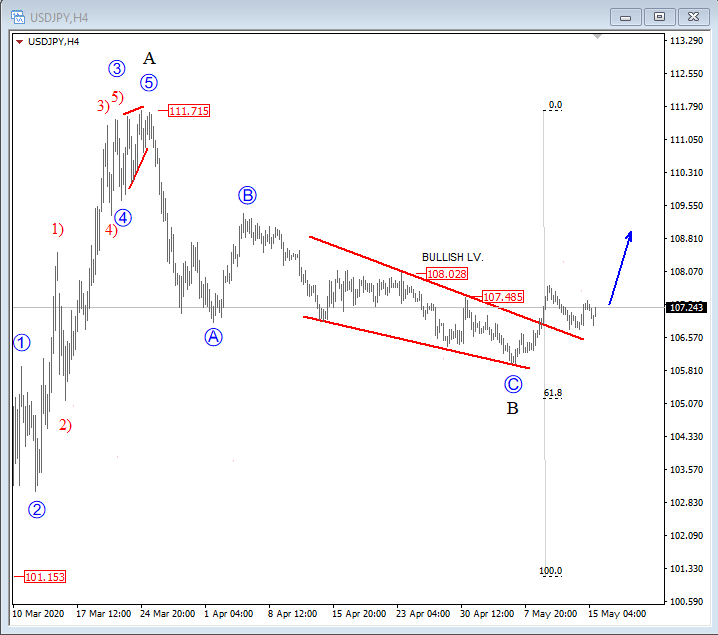
On 4h chart of USDJPY we see price completing higher degree wave B, slightly above 105.8 level, with an Elliott wave ending diagonal in C. Latest rally which breached the upper Elliott wave ending diagonal line, and is now trying to break above 108.03 level is evidence that the trend is turning bullish. However, we still want to see price rally above 108.03 level for confirmation that bulls took over.

USDJPY, 4h

An Elliott wave leading diagonal is a powerful reversal pattern, which tends to push price sharply into the opposite direction, and usually to the starting point of the pattern. In our case this is at 109.38 level.

An example of an Elliott wave ending diagonal:

  • structure is 3-3-3-3-3
  • a wedge shape within two converging lines
  • wave 4 must trade into a territory of a wave 1
  • appears primarily in the fifth wave position, in the C wave position of A-B-C and in double or triple threes as the final “C” wave

Trade well,

The EW-forecast team

Gregor Horvat

Gregor Horvat

Grega Horvat Grega is based in Slovenia and has been involved in markets since 2003. He is the owner of Ew-Forecast, but before that he was working for Capital Forex Group and TheLFB.com. His feature articles have been published on FXstreet.com, Thestreet.com, Action forex, Forex TV, Istockanalyst, ForexFactory, Fxtraders.eu, Insidefutures.com, etc. He recently won the award on FXStreet.com for Best Forex Analysis in 2016. At Ew-forecast he helps clients and educates them about the Elliott wave principle and how to label and track unfolding patterns in real time. His approach to the markets is mainly technical. He uses a lot of different methods when analyzing the markets such as candlestick patterns, MA, technical indicators etc. His specialty, however, is Elliott Wave Theory which could be very helpful especially if you know how to use it in combination with other tools/indicators. EW-Forecast To be involved in the market effectively, you need the right guidance and resources, and our team can help you to achieve that. Our team is providing advanced informations about Elliott Wave theory in real time. The Elliott Wave Principle gives you a method for identifying the behavior of the markets and at what points the market is most likely to turn. We help new traders who are interested in Elliott Wave theory to understand it correctly. We are doing our best to explain our views as simple as possible with educational goal, because knowledge itself is power!