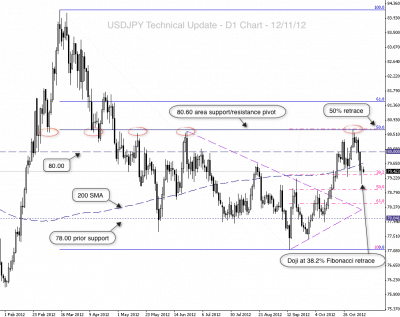
The dollar/yen pair has seen extended downside after price was capped on the 2/11/12, when it hit the 50% retrace of the last swing lower from 84.17 – 77.12. This level coincides with the historical 80.55-65 price pivot area on the USD/JPY. This price pivot is clear to see on the attached daily timeframe chart.
Guest post by Nick Simpson of www.forex-fx-4x.com

Interim support was found around the 80.00 handle, but price has ultimately dropped to a low of 79.31 over recent trading and formed a doji candle. The doji closed just above the 38.2% Fibonacci retrace of the rally from 77.12 – 80.66.
The key near term technical levels which could yet prove to be supportive are as follows:
- 38.2% Fibonacci retrace of the rally from 77.12 – 80.66, around 79.32.
- 19/9/12 daily high at 79.21.
- 50% retrace of 77.12 – 80.66 and 5/10/12 daily high are roughly aligned around 78.86.
- 78.00 prior support.
- 200 day SMA, currently around the 79.64 level.
- The 80.00 area (double zero psychological round number).
- The 80.60 area, 50% retrace of 84.17 – 77.12 and price pivot zone. This is also the highest level seen since the end of April.
