- VeChain price shows signs of recovery after a 32% crash.
- The Tom DeMark Sequential indicator presented a buy signal on the 4-hour chart.
- A bounce from 23.6% Fibonacci retracement level could push VET by 15% to $0.47.
VeChain price witnessed a brutal 45% sell-off that kicked off on February 12. Although VET crashed as low as $0.033, market participants are aggressively buying the dips.
VeChain price could bounce higher
VeChain price began trending lower after hitting a local top of $0.061 on February 12. However, Tuesday’s trading session sealed VET’s fate as it dropped 32% in less than eight hours to hit a low of $0.033.
Despite the significant losses, the Tom DeMark (TD) Sequential indicator has flashed a buy signal in the form of a red nine candlestick on the 4-hour chart. This setup forecasts a one to four 4-hour candlestick upswing in VeChain price.
So long as VET holds above the 23.6% Fibonacci retracement level at $0.040, the optimistic outlook prevails.
In such a case, buying pressure could snowball, pushing VeChain price towards the 50% Fibonacci retracement level at $0.047, representing a 10% upswing from the current price.
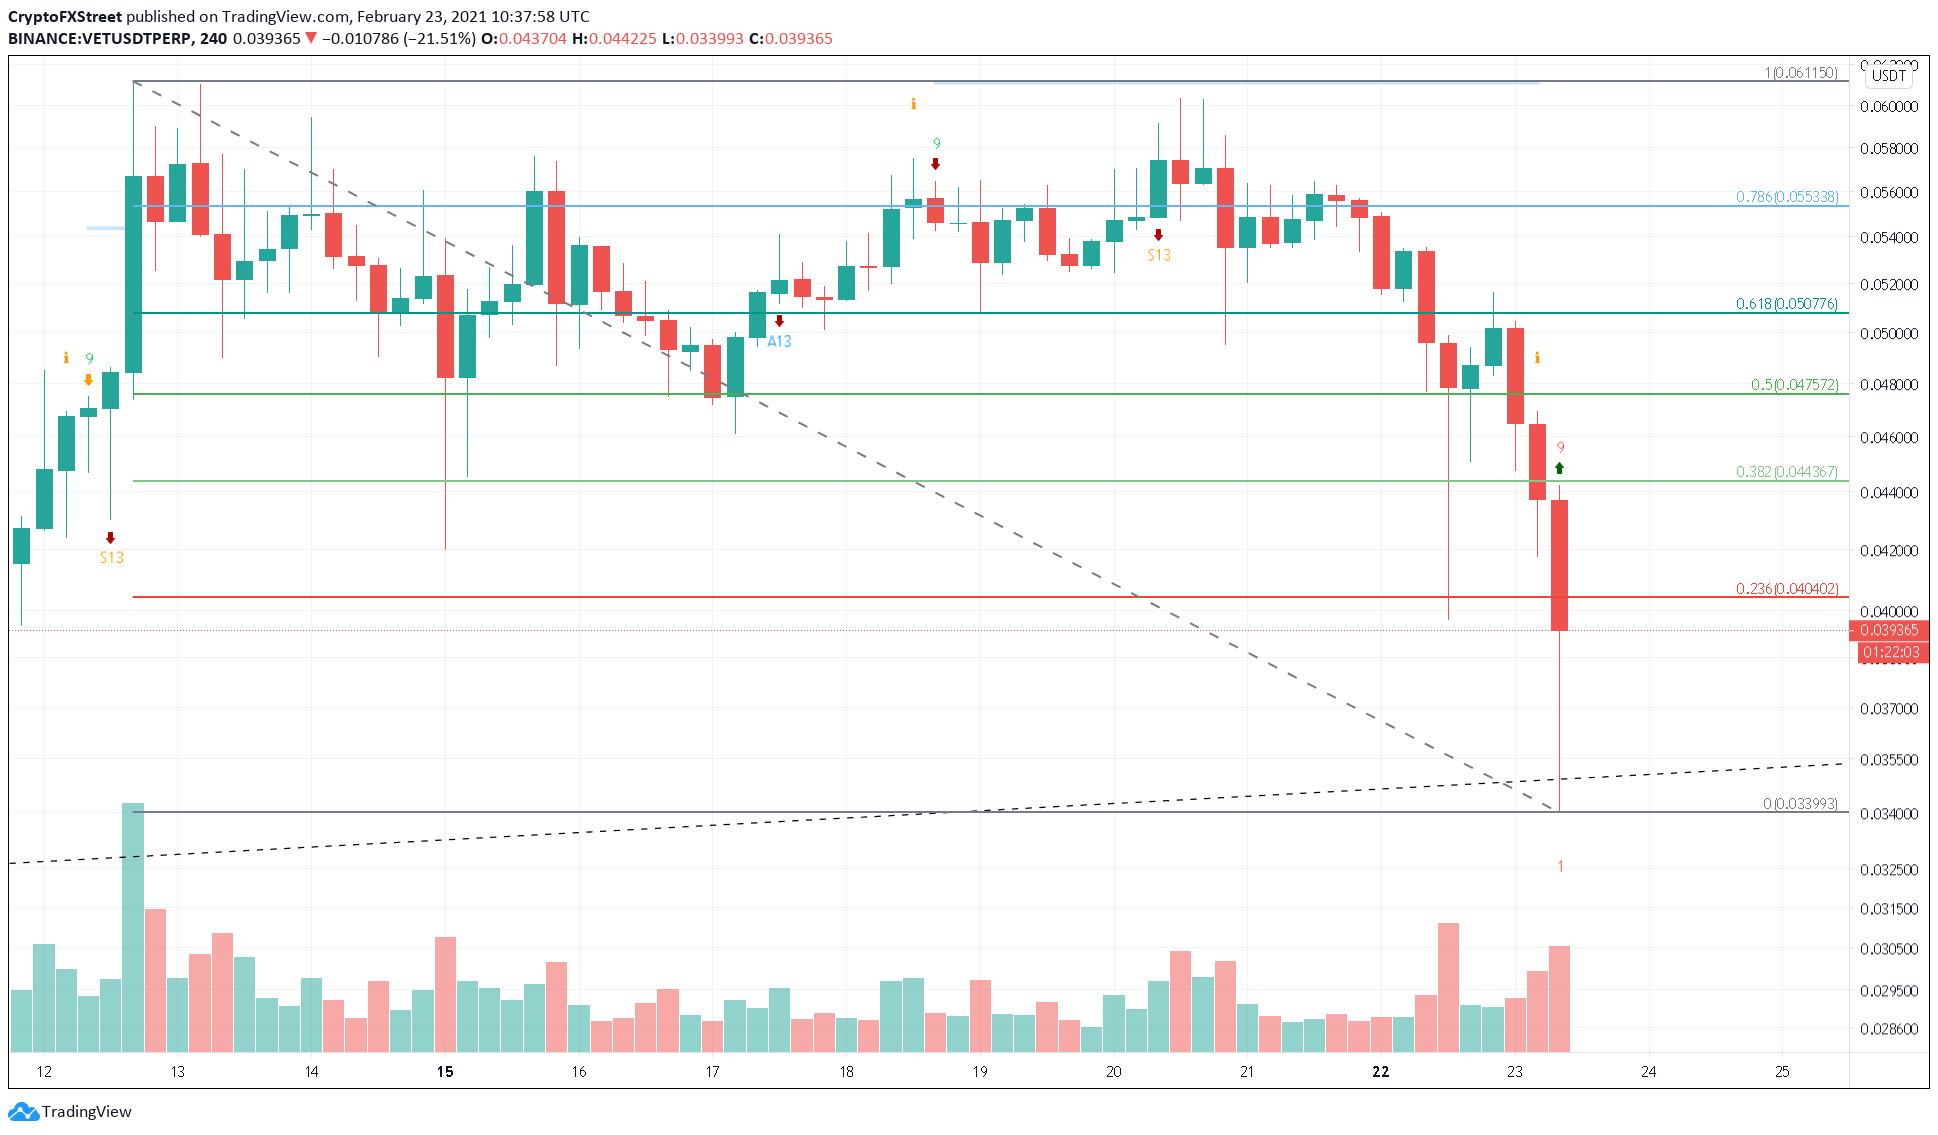
VET/USDT 4-hour chart
Regardless of the buy signal, if VeChain price fails to stay above $0.040, sellers could drag it down by 15% to revisit the recent low of $0.033.
