- Vechain price is trading inside an ascending parallel channel on the 4-hour chart.
- The digital asset must hold a critical support level to avoid a significant drop.
- A key indicator has presented a sell signal for VET.
VeChain price had a significant recovery from the last crash and aims for a new high if it can hold a crucial support level.
VeChain price on its way to new highs
On the 4-hour chart, VeChain has formed an ascending parallel channel which can be drawn by connecting the higher highs and higher lows with two parallel trend lines.
The lower trend line support at $0.23 coincides with the 26 EMA as well, which means it is a robust support point.
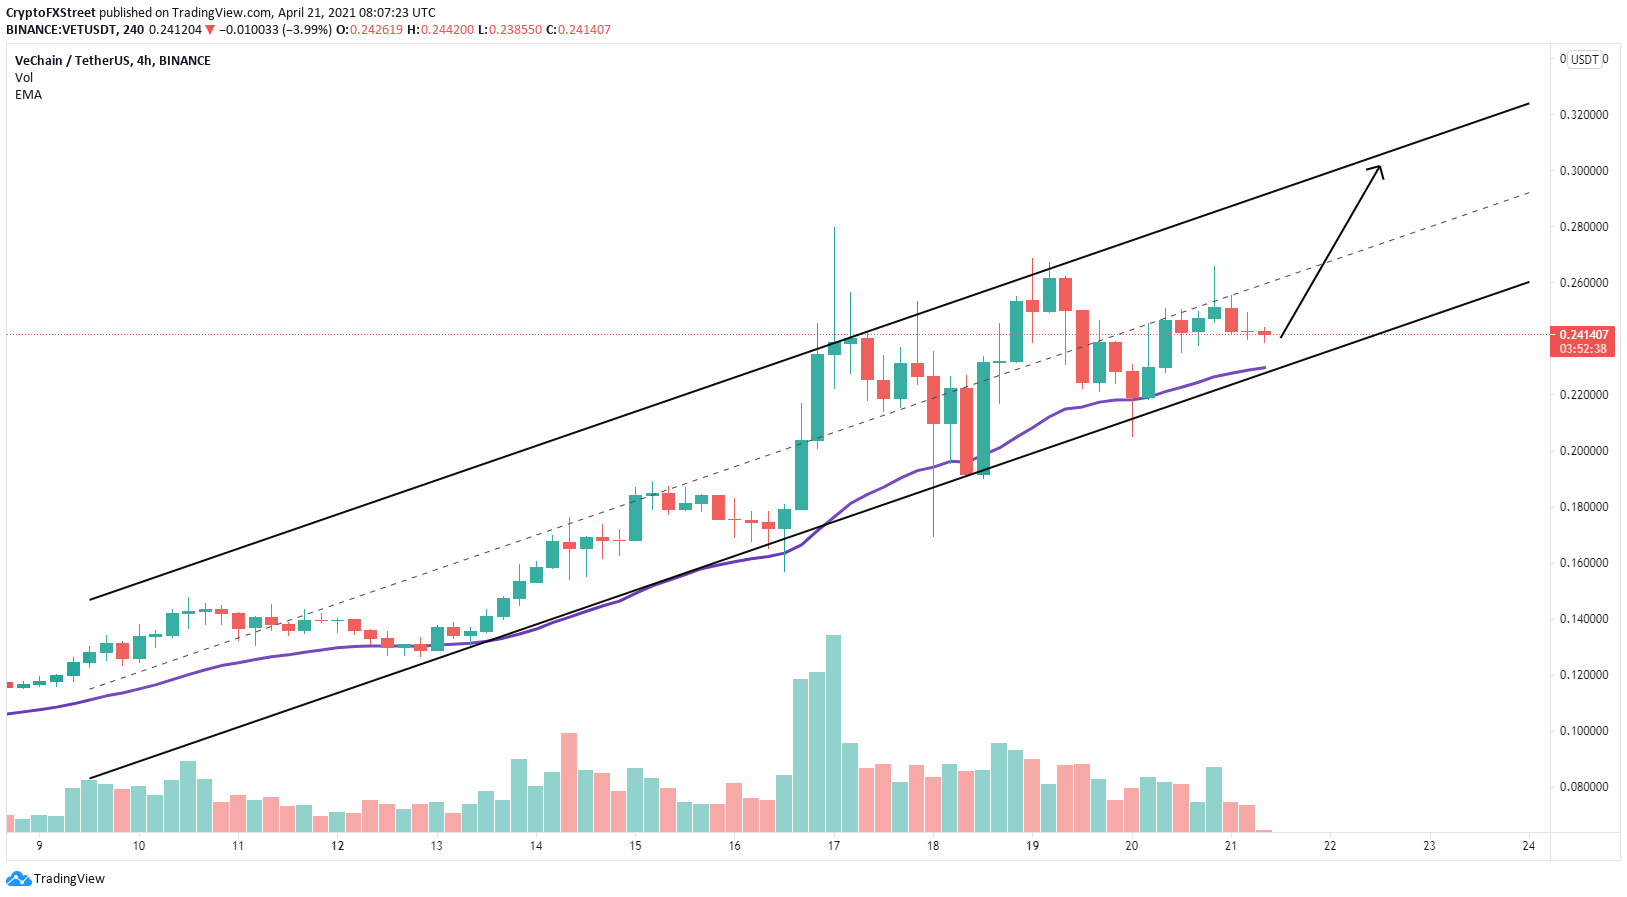
VET/USD 4-hour chart
The initial price target of this rebound would be $0.27 at the middle trend line of the pattern and the next the upper boundary at $0.30.
However, on the daily chart, the TD Sequential indicator has just presented a sell signal in the form of a green ‘9’ candlestick. In the past months, this indicator has proven to be quite accurate.
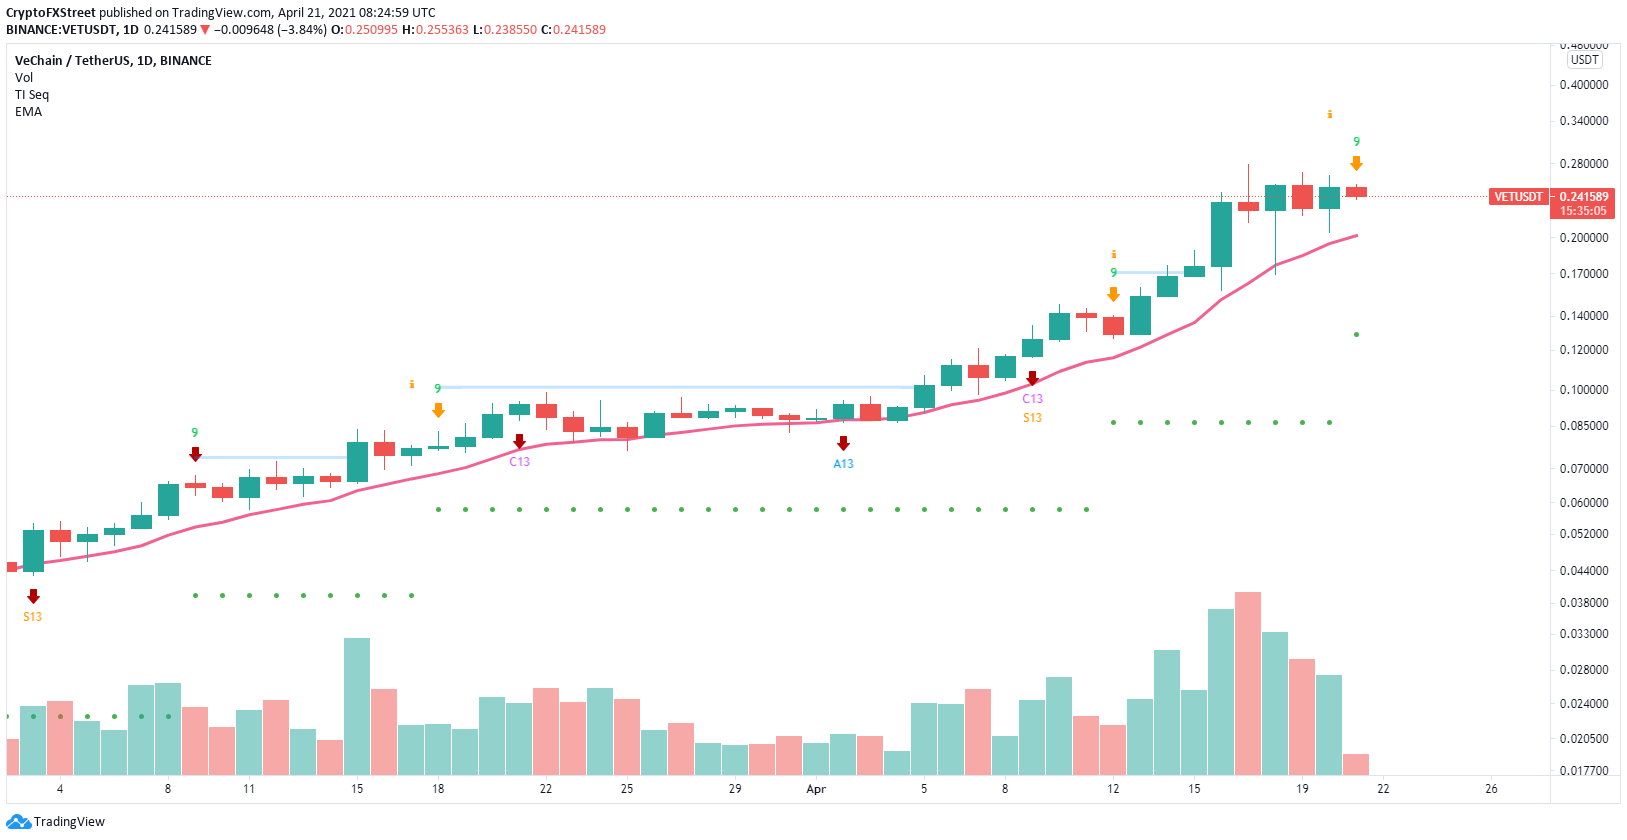
VET/USD daily chart
The most significant support level is the 12 EMA at $0.20, which would be the bearish price target if the signal is confirmed.
