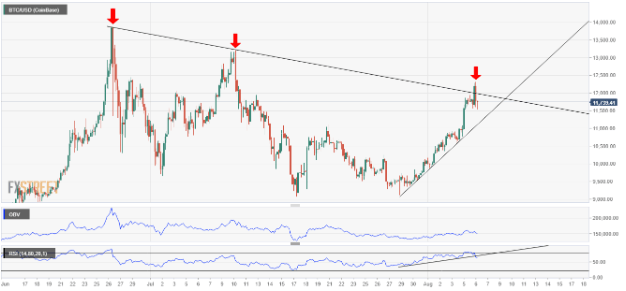
Above is the 4-hour BTC/USD chart that shows there was a key trendline set in place from the high seen on the 26th June to the next lower high made in 10th July. Today the BTC/USD price broke through the barrier but quickly rejected and broke back through backed by large volume.
The RSI indicator has also broken a bearish trendline to break lower. This comes after being in the overbought (positive) zone for some time. Does this mean the upside momentum is done? Not really, maybe it just means the price may have moved too far too quickly and some profit-taking is kicking in.
The on-balance volume (OBV) indicator is showing steadily increasing volume as the upward trend developed. At the top of the trend on the two bar reversal candles the volume peaked. This is also a bearish signal so in the base case view we can expect a pullback before the bulls test BTC/USD higher or the bears drag the price lower. The on-balance volume indicator measures the volume against up candles and down candles. If there is more volume as the price is rising the indicator will move higher and vice versa if prices are moving lover.

