- Prices of WTI trade on an upbeat tone beyond $63.00 per barrel.
- Traders remain concerned over supply conditions.
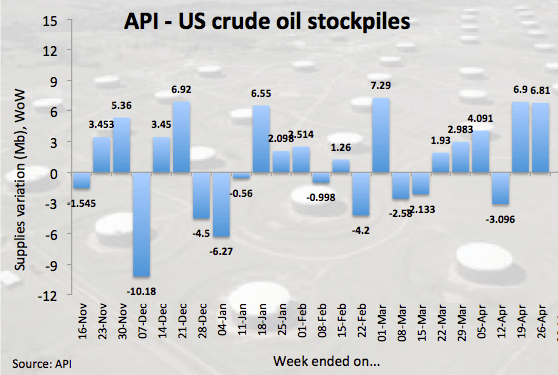
- API reported a 6.8M barrel build late on Tuesday.
The barrel of WTI is reversing yesterday’s negative performance and is posting decent gains beyond the $63.00 mark ahead of key events in the US calendar.
WTI looks to data, Fed
Crude oil prices regained composure today following persistent jitters among traders regarding the likeliness of tighter supply conditions in the markets as a result of the US ending its waiver programme for buyers of Iranian oil.
However, concerns appear to persist in spite of efforts by the White House in combination with Saudi Arabia and the UAE to keep the markets ‘adequately supplied’.
WTI has also managed to leave behind another weekly build in US crude oil supplies, as reported by the American Petroleum Institute late on Tuesday (around 6.8M barrel). Later today, it will be the EIA’s turn to publish its usual weekly report on US crude oil inventories.
In addition, traders should closely follow the upcoming FOMC meeting and the subsequent press conference by Fed’s J.Powell for near term direction in the buck.
What to look for around WTI
WTI climbed to fresh 6-month highs beyond the $66.00 mark per barrel last week, although the up move apparently lacked of sustainability. In the meantime, US sanctions against Iranian crude oil exports and the response from OPEC members to the probable supply disruptions are posed to drive the sentiment in the near term along with rising geopolitical effervescence in Libya and developments from the US-China trade talks in Beijing this week. Looking at the broader scenario, the so-called ‘Saudi put’, tighter conditions in the US oil market, the current OPEC+ deal to curb oil output, favourable speculative positioning and increasing turmoil in Venezuela keep propping up the underlying bullish view on crude oil.
WTI significant levels
At the moment the barrel of WTI is gaining 0.61% at $63.75 and a surpass of $66.46 (2019 high Apr.23) would expose $68.06 (low Oct.29 2018) and finally $69.60 (78.6% Fibo of the October-December drop). On the downside, the next support is located at $62.16 (low Apr.26) seconded by $61.64 (low Apr.5) and then $60.82 (200-day SMA).