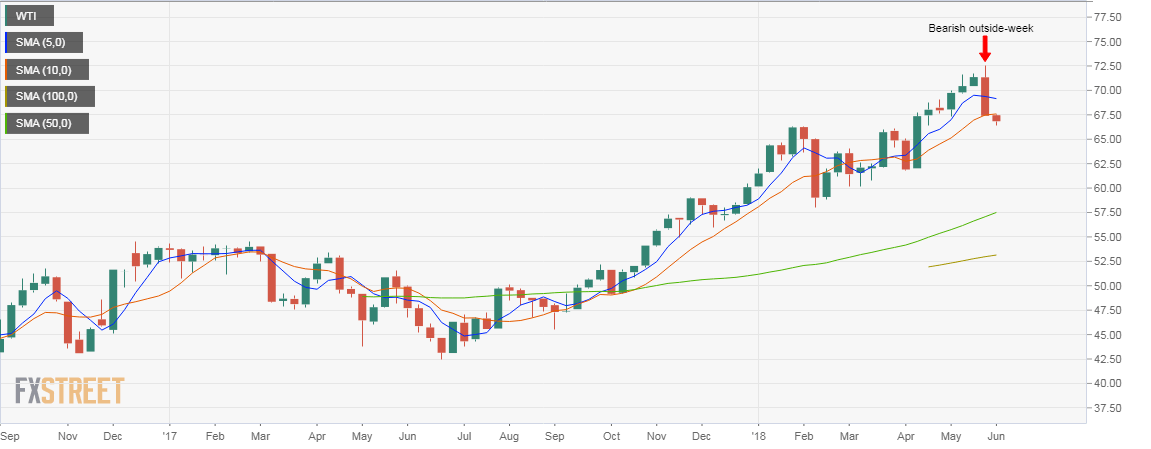
- The last weekly candle is a bearish outside-week, WTI chart shows.
- OPEC and Russia are to discuss easing the self-imposed supply restrictions.
Weekly chart
Current Price: $66.80/barrel
Daily Change: -1.5 percent
Daily High: $67.15
Daily Low: $66.74
Trend: Bearish
Resistance
$67.66 (50-day MA)
$68.76 (5-day MA)
$69.56 (April 19 high)
Support
$66.65 (January 25 high)
$65.81 (previous day’s low)
$65.21 (100-day MA)
The bearish outside-week candle indicates the rally from the June 2017 low of $42.06 may have run out of steam. The sharp decline from $72.90 to $65.81 could be associated with fears that OPEC and Russia may ease self-imposed supply caps at the June 22 meeting in Vienna. Saudi energy minister Khalid Al-Falih said on Friday that the Kingdom and Russia are considering pumping more oil to ease supply concerns.
