- The bullish divergence of the relative strength index (RSI) seen in the hourly chart indicates scope for a test of supply around the falling trendline hurdle, currently at $64.70/barrel.
- A break above $64.14 would also confirm a double bottom breakout and would allow a rally to $65.15 (target as per the measured move method).
- The bullish outlook would be invalidated if priced find acceptance under the recent low of $63.50.
- The WTI oil is currently trading at $62.90.
Hourly Chart
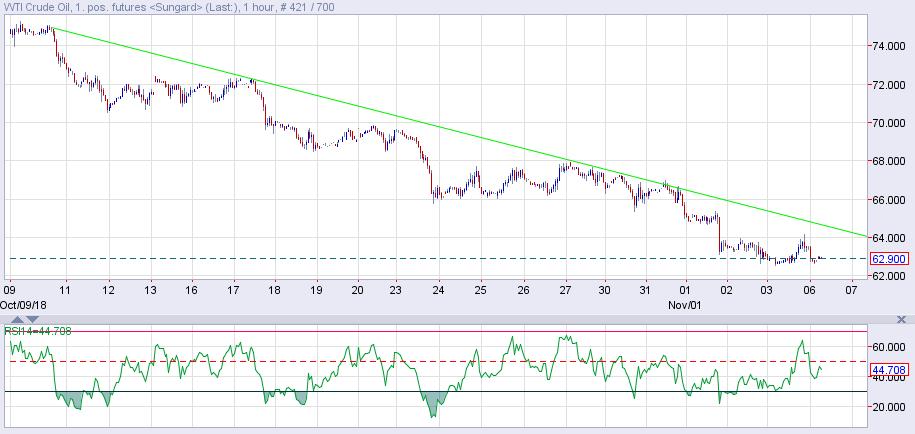
Trend: Bullish
WTI
Overview:
Last Price: 62.88
Daily change: 4.0 pips
Daily change: 0.0637%
Daily Open: 62.84
Trends:
Daily SMA20: 67.41
Daily SMA50: 70.02
Daily SMA100: 69.14
Daily SMA200: 68.54
Levels:
Daily High: 62.9
Daily Low: 62.71
Weekly High: 67.73
Weekly Low: 62.61
Monthly High: 76.25
Monthly Low: 64.86
Daily Fibonacci 38.2%: 62.83
Daily Fibonacci 61.8%: 62.78
Daily Pivot Point S1: 62.73
Daily Pivot Point S2: 62.63
Daily Pivot Point S3: 62.54
Daily Pivot Point R1: 62.92
Daily Pivot Point R2: 63.01
Daily Pivot Point R3: 63.11
