- WTI consolidates from $36.50 after marking the heaviest drop since late-April.
- MACD turns the most bearish since March, a confluence of 50 and 200-day SMA offers strong upside resistance.
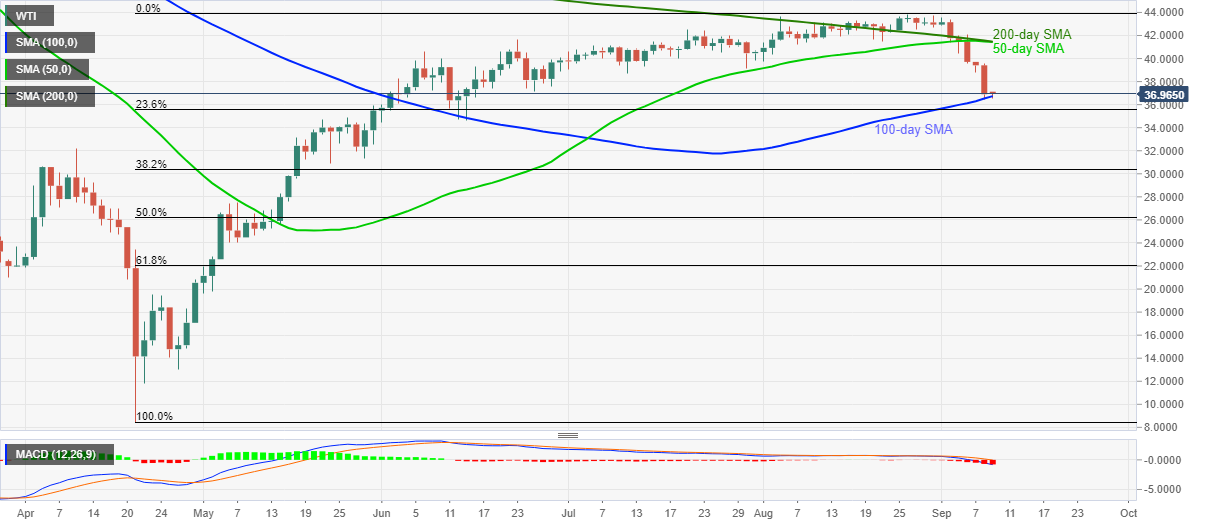
WTI extends pullback from $36.50 to $36.85 during Wednesday’s Asian session. In doing so, the energy benchmark bounces off the lowest since June 15 as 100-day SMA probes the sellers. Though, a sustained trading below the joint of 50 and 200-day SMA and downbeat MACD signals raise bars for the bulls’ entry.
Against this backdrop, the quote’s pullback to June 25 low of $37.17 can’t be ruled out while any further recoveries will be tamed by July month’s bottom near $39.10.
It should, however, be noted that the $40.00 threshold can also act as an immediate upside barrier before highlighting the key resistance confluence around $41.40/45.
Alternatively, a daily closing below the 100-day SMA level of $39.73 will direct the bears to the late-May high around $34.90 before highlighting June month’s trough surrounding $34.60.
During the black gold’s further weakness past-$34.60, the May 22 low of $30.87 can act as a buffer ahead of the highlighting the $30.00 to sellers.
WTI daily chart
Trend: Pullback expected
